Plans Underway for Large-Scale Lithium Hydroxide Production in Québec
Superior Court of Québec approves Sayona Québec’s acquisition of North American Lithium (“NAL”)
Total cash consideration of approximately C$94mm with transaction completion expected in Q3 2021
Piedmont will fund approximately C$23.5mm, representing its 25% stake in Sayona Québec
Detailed study of the integration of NAL with Sayona Québec’s Authier Project to commence in the coming weeks
Sayona and Piedmont jointly committed to development of lithium hydroxide capacity in Québec
BELMONT, N.C. – Piedmont Lithium Inc. (Nasdaq: PLL) is pleased to announce that the Superior Court of Québec (Commercial Division) has granted an approval and vesting order regarding the Company’s joint bid with Sayona Mining Limited (ASX:SYA) for the acquisition of North American Lithium (“NAL”) by Sayona Québec Inc. (“Sayona Quebec”) in the context of the Companies’ Creditors Arrangement Act (CCAA) proceedings of NAL. Piedmont is a 25% shareholder of Sayona Québec and owns 19.79% of the outstanding common shares of Sayona Mining Limited.
At the completion of the transaction Sayona Québec will acquire all the issued and outstanding shares of NAL and substantially all of its assets. The order of Superior Court of Québec provides that the assets acquired in the transaction will be free and clear of any encumbrances other than certain specific permitted encumbrances accepted by Sayona Québec.
NAL owns a large, previously-producing lithium asset project located approximately 20 miles from Sayona’s core Authier project near the important mining center of Val-d’Or in the Abitibi region of Québec. NAL is fully permitted, has a Mineral Resource of 57.7Mt @ 1.05% Li2O, and has had over $400 million invested in mining, concentrate and refining capacity. The project was operational and ramping toward nameplate production in 2018, when it was placed on care and maintenance due to weak lithium markets and a sub-optimal capital structure.
Sayona and Piedmont are proceeding with technical studies that contemplate integrating Sayona Québec’s Authier and Tansim projects with the facilities at NAL, including restart requirements, technical improvements, and optimization of NAL operations in order to fully utilize this competitive set of assets. Furthermore, Sayona and Piedmont will prioritize manufacturing of lithium hydroxide in Québec, capitalizing on Québec’s competitive advantages, including access to zero-carbon, low-cost hydropower, skilled labor, world-class infrastructure, and the initiative of both the Canadian and provincial governments to develop the lithium-ion battery materials and EV industry.
Keith D. Phillips, President and Chief Executive Officer, commented: “We are very pleased to be working with our partners at Sayona to consolidate the spodumene resources in the Abitibi region of Québec. NAL is a past-producing business with a large, high-grade mineral resource located in close proximity to Sayona’s Authier project and to the important mining center of Val-d’Or, Québec. We will work closely with Sayona to refine the plans to unify the Authier and NAL spodumene operations, and we are both committed to building integrated spodumene to lithium hydroxide capacity in Québec. Piedmont strongly believes that ‘location and regionalization of the battery supply chain matters,’ and the combined Québec operations will be well-positioned to serve the fast-growing North American electric vehicle business. The Québec operations are an ideal complement to our flagship Carolina Lithium Project in Gaston County, NC, and further Piedmont’s objective of being North America’s leading lithium hydroxide producer.”
About Piedmont Lithium Piedmont Lithium (Nasdaq:PLL; ASX:PLL) is developing a world-class integrated lithium business in the United States, enabling the transition to a net zero world and the creation of a clean energy economy in America. Our location in the renowned Carolina Tin Spodumene Belt of North Carolina, the cradle of the lithium industry, positions us to be one of the world’s lowest cost producers of lithium hydroxide, and the most strategically located to serve the fast-growing US electric vehicle supply chain. The unique geographic proximity of our resources, production operations and prospective customers places us on the path to be among the most sustainable producers of lithium hydroxide in the world and should allow Piedmont to play a pivotal role in supporting America’s move to the electrification of transportation and energy storage. For more information, visit www.piedmontlithium.com.
Forward Looking Statements This announcement may include forward-looking statements. These forward-looking statements are based on Piedmont’s expectations and beliefs concerning future events. Forward looking statements are necessarily subject to risks, uncertainties and other factors, many of which are outside the control of Piedmont, which could cause actual results to differ materially from such statements. Piedmont makes no undertaking to subsequently update or revise the forward-looking statements made in this announcement, to reflect the circumstances or events after the date of that announcement. U.S. investors are urged to consider Piedmont’s disclosure in its SEC filings, copies of which may be obtained from Piedmont or from the EDGAR system on the SEC’s website at http://www.sec.gov/.
Cautionary Note to United States Investors Concerning Estimates of Measured, Indicated and Inferred Mineral Resources
The information contained herein and previously reported by North American Lithium has been prepared in accordance with the requirements of the securities laws in effect in Canada, which differ from the requirements of United States securities laws. The terms “mineral resource”, “measured mineral resource”, “indicated mineral resource” and “inferred mineral resource” are Canadian mining terms defined in accordance with the requirements of NI 43-101. Comparable terms are now also defined by the U.S. Securities and Exchange Commission (“SEC”) in its newly adopted Modernization of Property Disclosures for Mining Registrants as promogulated in its S-K 1300 standards. While the guidelines for reporting mineral resources, including subcategories of measured, indicated, and inferred resources, are largely similar for NI 43-101 and S-K 1300 standards, information contained herein that describes North American Lithium’s mineral deposits is not fully comparable to similar information made public by U.S. companies subject to reporting and disclosure requirements under the U.S. federal securities laws and the rules and regulations thereunder. Piedmont does not guaranty or verify the accuracy of any of the historical reporting of North American Lithium.
Piedmont Lithium Inc. (“Piedmont” or the “Company”) is pleased to report the results of the updated scoping study (“Scoping Study” or “Study”) for its proposed integrated lithium hydroxide business (“Carolina Lithium” or the “Project”) in Gaston County, North Carolina. The Study confirms that Carolina Lithium will be one of the world’s largest and lowest-cost producers of lithium hydroxide, with a sustainability footprint that is superior to incumbent producers, all in an ideal location to supply the rapidly growing electric vehicle supply chain in the United States.
PROJECT HIGHLIGHTS
Sustainable Lithium Hydroxide Manufacturing
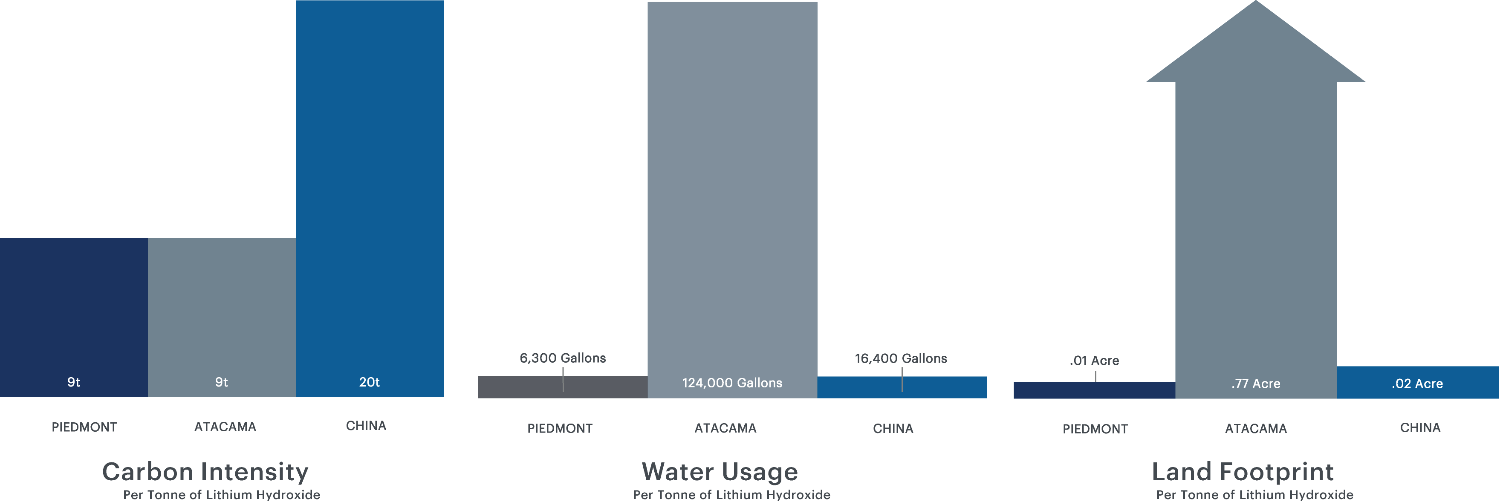
Piedmont Carolina Lithium is expected to have a superior sustainability profile relative to the current producers based in China and South America. Chinese lithium producers are highly reliant on coal-fired power and generally utilize a carbon-intensive sulfuric acid roasting process to convert raw materials shipped in from Australia, while South American producers tend to utilize vast tracts of land and large quantities of water, all in the driest desert in the world, the Atacama.
Metso Outotec process reduces emissions, eliminates sulfuric acid roasting, and reduces solid waste
Solar power generation, in-pit crushing, and electric conveying reduce reliance on carbon-based energy sources
Vastly diminished transportation distances for raw materials and finished product
Highly efficient land and water use compared with South American brine production
Far lower CO2 intensity than incumbent China hydroxide production including Scope 1, 2, and 3 emissions
Independent preliminary Life-Cycle Analysis (“LCA”) completed with Minviro
Figure 1 – Life cycle analysis of key carbon intensity, water usage, and land footprint of Piedmont Carolina Lithium
Exceptional Economics and Scale
The Study confirms that Piedmont will be a large and low-cost producer of lithium hydroxide, benefitting from its ideal location in Gaston County, North Carolina, with exceptional infrastructure, a deep local talent pool, low-cost energy, and proximity to local markets for the monetization of by-product industrial minerals. The Study results represent a substantial improvement over prior studies despite the use of more conservative assumptions related to mining dilution and metallurgical recoveries.
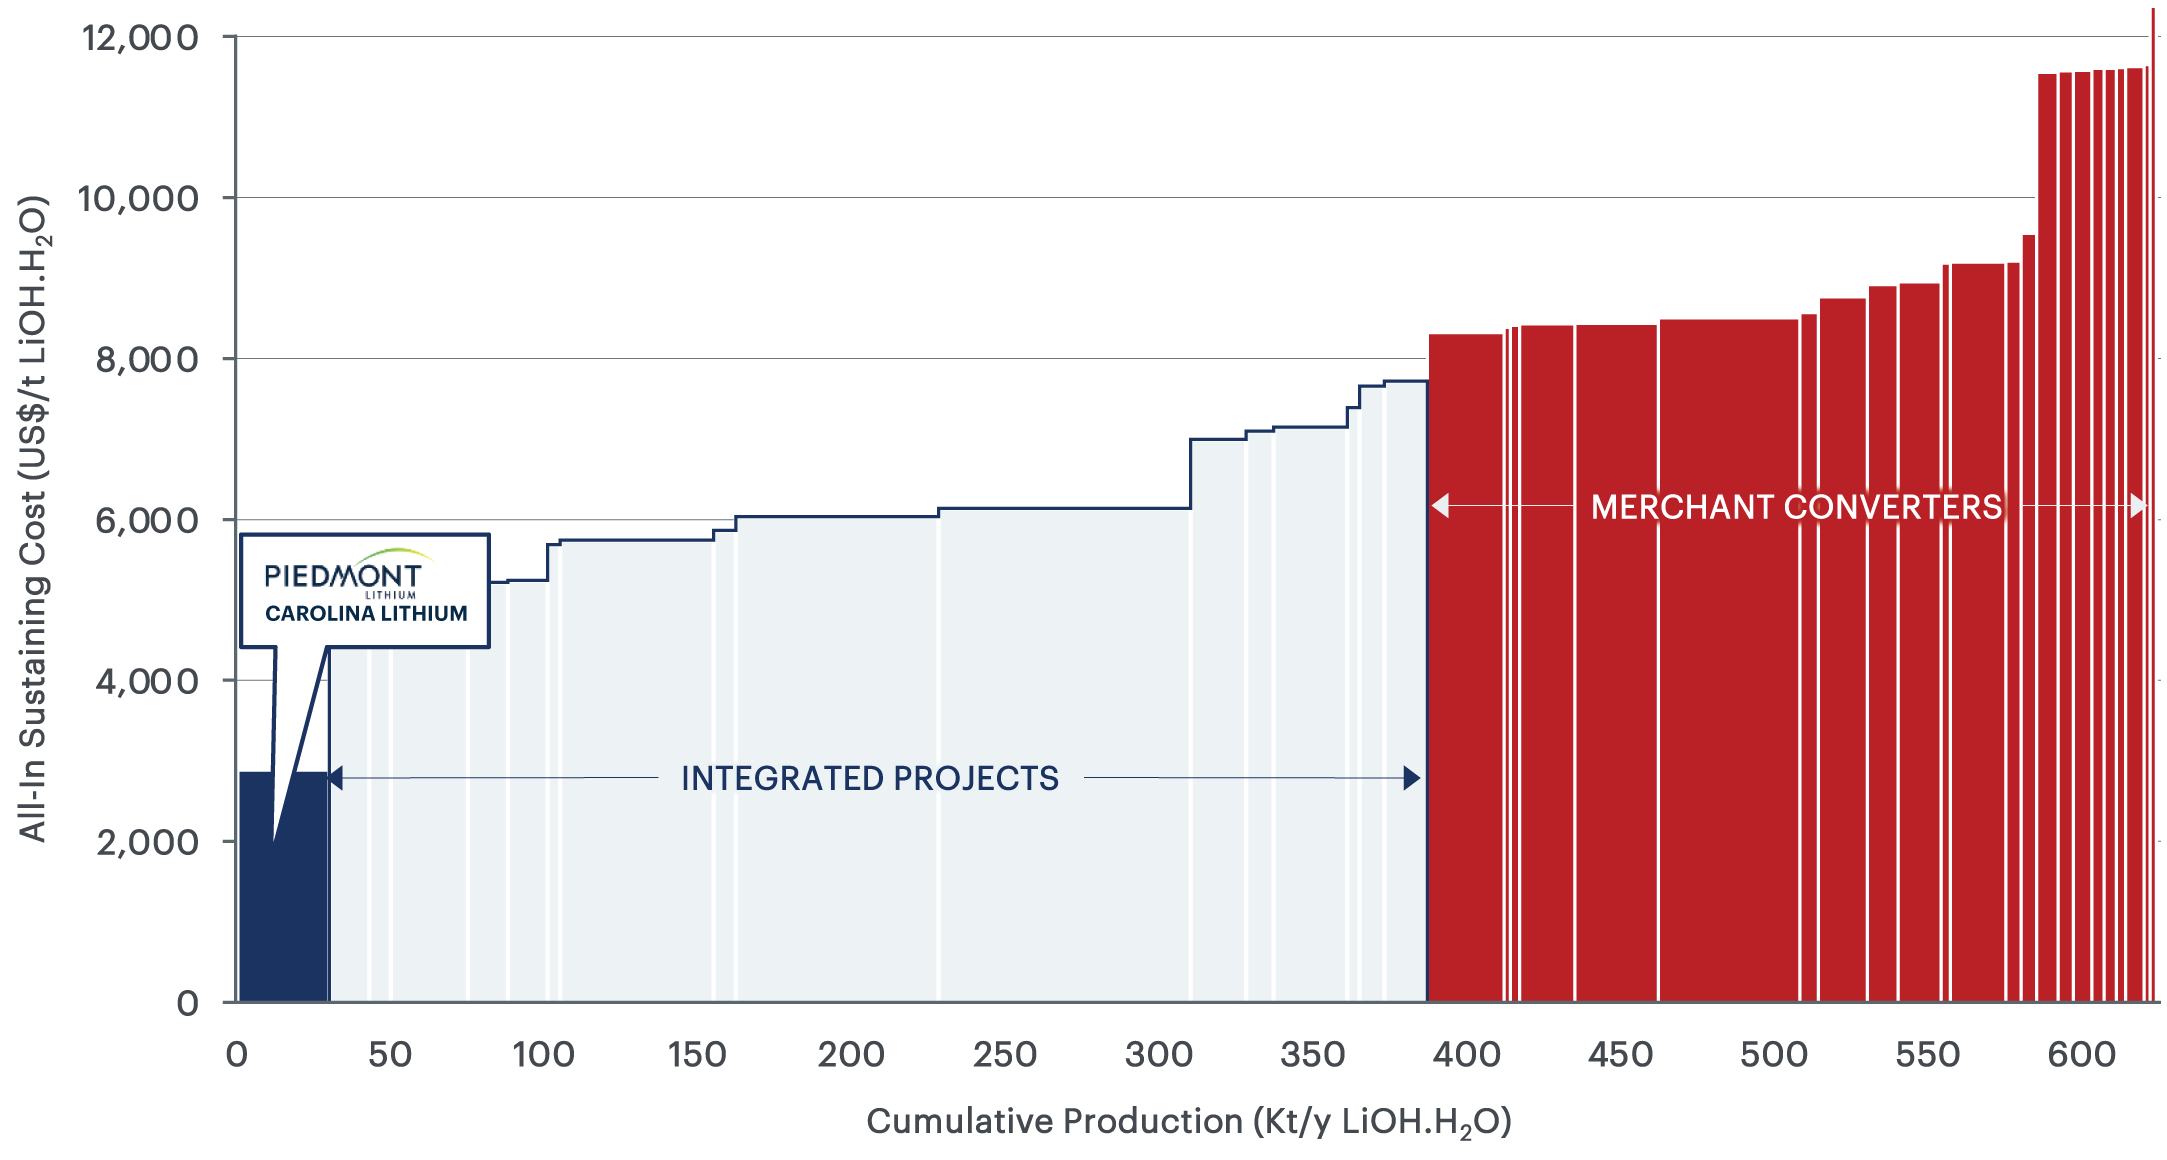
The competitive advantage of Piedmont’s unique location is depicted in the following lithium hydroxide cost curve, which was prepared by Roskill, a leading lithium industry consultancy.
Figure 2 – Lithium hydroxide 2028 AISC cost curve (real basis) (Roskill) AISC includes all direct and indirect operating costs including feedstock costs (internal AISC), refining, corporate G&A and selling expenses.
Fully Integrated Manufacturing Campus
Piedmont Carolina Lithium contemplates a single, integrated site, comprising quarrying, spodumene concentration, by-products processing, and spodumene conversion to lithium hydroxide. There are currently no such integrated sites operating anywhere in the world, and the economic and environmental advantages of this strategy are compelling:
Premier location in Gaston County, North Carolina – “the cradle of the lithium business”
Elimination of SC6 transportation costs and related noise and emissions
On-site solar complex to power concentrate operations and reduce reliance on diesel fueled equipment
Potential to co-locate other downstream battery materials / Li-ion battery manufacturing
Creation of up to 500 manufacturing, engineering, and management jobs
Site offers potential to expand hydroxide capacity by adding additional manufacturing trains in the future
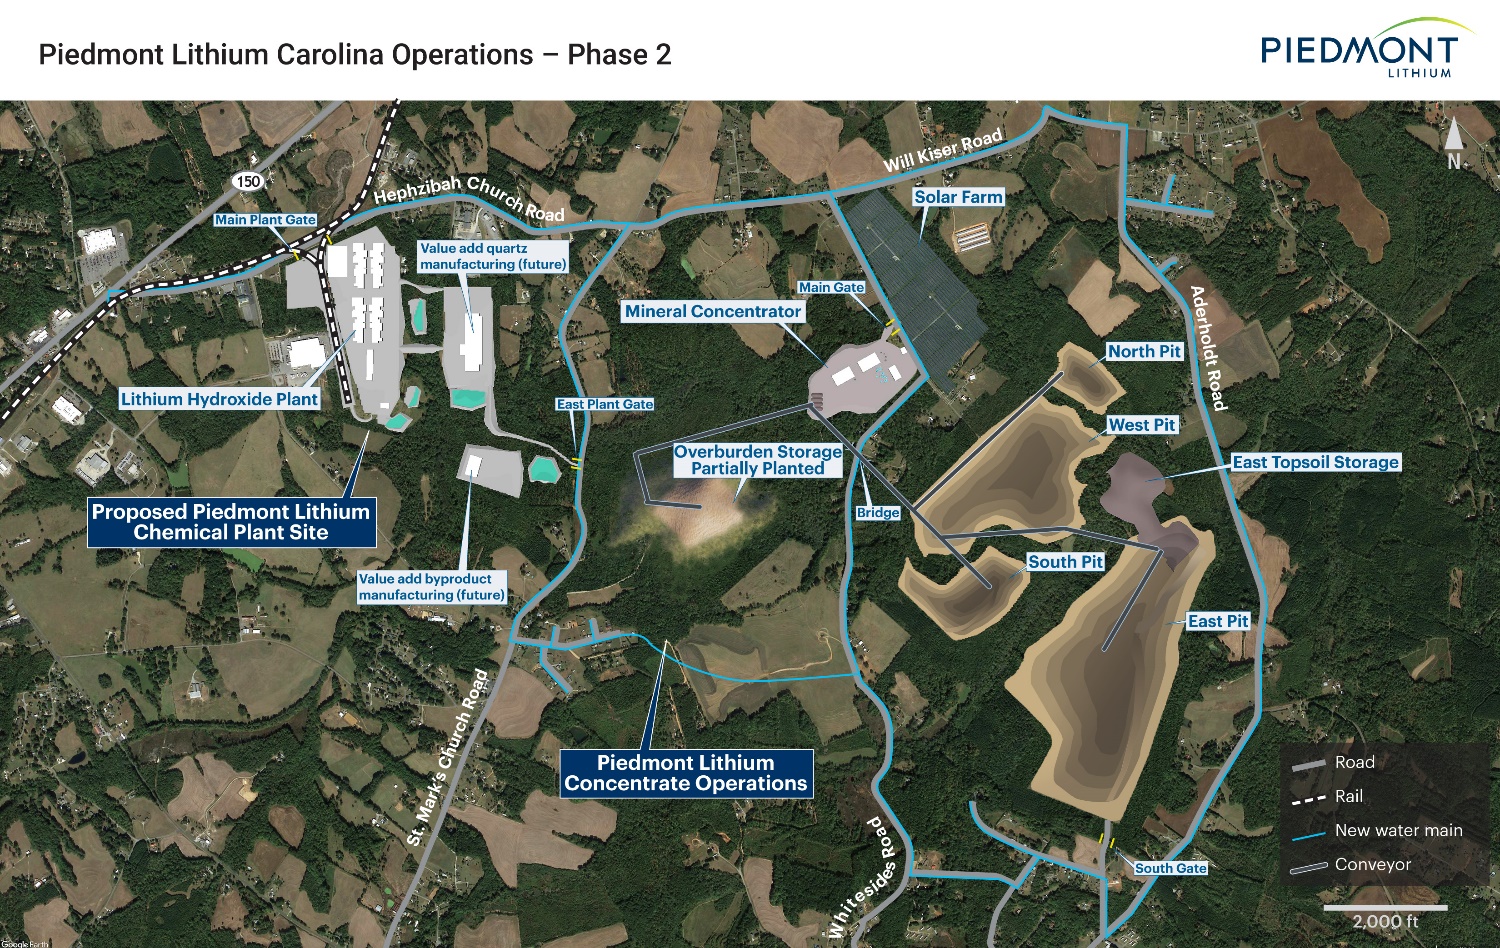
Figure 3 – Indicative proposed site plan for Piedmont’s Carolina Lithium operations
“We are exceedingly pleased with the results of our updated Scoping Study. The economics of our Project continue to impress, but I am particularly proud of the Project’s sustainability profile. Customers, investors, and neighbors are increasingly focused on businesses that are “doing things the right way.” It is critical that raw material supply chains do not detract from the overall sustainability of the transition to electric vehicles. Our project will have a far lower environmental footprint than alternative suppliers, and we expect that to position Piedmont well with all stakeholders.
As we move forward to complete a Definitive Feasibility Study for Carolina Lithium later in 2021, Piedmont has engaged Evercore and JPMorgan as financial advisors to evaluate potential strategic partnering and financing options for its North Carolina Project. Given the Project’s unique position as the only American spodumene project, with world-class scale, economics, and sustainability, we expect strategic interest to be robust.
Keith D. Phillips, President and Chief Executive Officer
scoping study update
Piedmont’s Carolina Lithium Scoping Study Update is based on the Company’s Mineral Resource estimate reported in April 2021, of 39.2 Mt at a grade of 1.09% Li2O and the by-product Mineral Resource estimates comprising 7.4 Mt of quartz, 11.1 Mt of feldspar and 1.1 Mt of mica reported in June 2021.
The fully integrated Study contemplates a 20-year project life, with the downstream lithium hydroxide chemical plant commencing 90 days after the start of concentrate operations. The chemical plant is assumed to achieve full capacity within 12 months. Table 1 provides a summary of production and cost figures for the integrated Project.
Table 1: Project Summary Outcomes
Unit
Estimated Value
Annual Production
Operation life
years
20
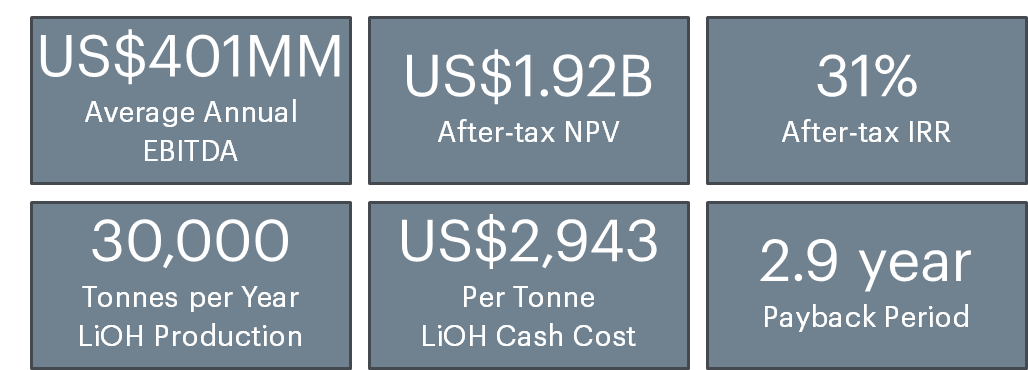
Steady state annual lithium hydroxide production
t/y
30,000
Average annual spodumene concentrate (SC6) production
t/y
248,000
Average annual quartz production
t/y
252,000
Average annual feldspar production
t/y
392,000
Average annual mica production
t/y
70,000
Life-of-Mine (“LOM”) Production
Production target
Mt
37.41
LOM SC6 production
Mt
4.96
LOM quartz production
Mt
4.83
LOM feldspar production
Mt
7.51
LOM mica production
Mt
1.34
LOM feed grade (excluding dilution)
%
1.09
LOM average concentrate grade
%
6.0
LOM average process recovery
%
80
LOM average strip ratio
waste:ore
12.2:1
Operating and Capital Costs
Average LiOH production cash costs
US$/t
$2,943
Average LiOH production all in sustaining costs
US$/t
$3,145
Direct development capital
US$MM
$639.0
Land acquisition costs
US$MM
$28.0
Other owner’s costs
US$MM
$43.8
Contingency
US$MM
$127.8
Total initial capital cost
US$MM
$838.6
Sustaining and deferred capital
US$MM
$337.9
Working capital
US$MM
$48.3
Financial Performance
Average annual steady state EBITDA
US$MM/y
$401
Average annual steady state after-tax cash flow
US$MM/y
$315
After tax Net Present Value (“NPV”) @ 8% discount rate
US$MM
$1,923
After tax Internal Rate of Return (“IRR”)
%
31%
Payback from start of operations
years
2.9
Updates from Prior Studies
Notable improvements to business outcomes have been achieved in this Study compared with the prior scoping study published in May 2020. Key updates are reflected in Table 2.
Table 2: Comparative Outcomes of 2021 and 2020 Scoping Studies
Outcomes
Unit
2021 Study
2020 Study
Project life
years
20
25
Steady-state average annual lithium hydroxide production
t/y
30,000
22,720
Steady-state average annual spodumene concentrate production
t/y
248,000
160,000
Steady-state average annual by-product production (all products)
t/y
714,000
224,000
Long term lithium hydroxide price
US$/t
$15,239
$12,910
Long term spodumene concentrate price
US$/t
$762
$564
Steady-state average cash cost of lithium hydroxide production
US$/t
$2,943
$3,712
Steady-state average cost of spodumene concentrate production
US$/t
$181
$201
Initial capital cost (including contingency)
US$MM
$838
$545
Steady-state average annual EBITDA
US$MM/y
$401
$218
After tax NPV @ 8% discount rate
US$MM
$1,923
$1,071
After tax IRR
%
31%
26%
Payback from start of operations
years
2.92
3.23
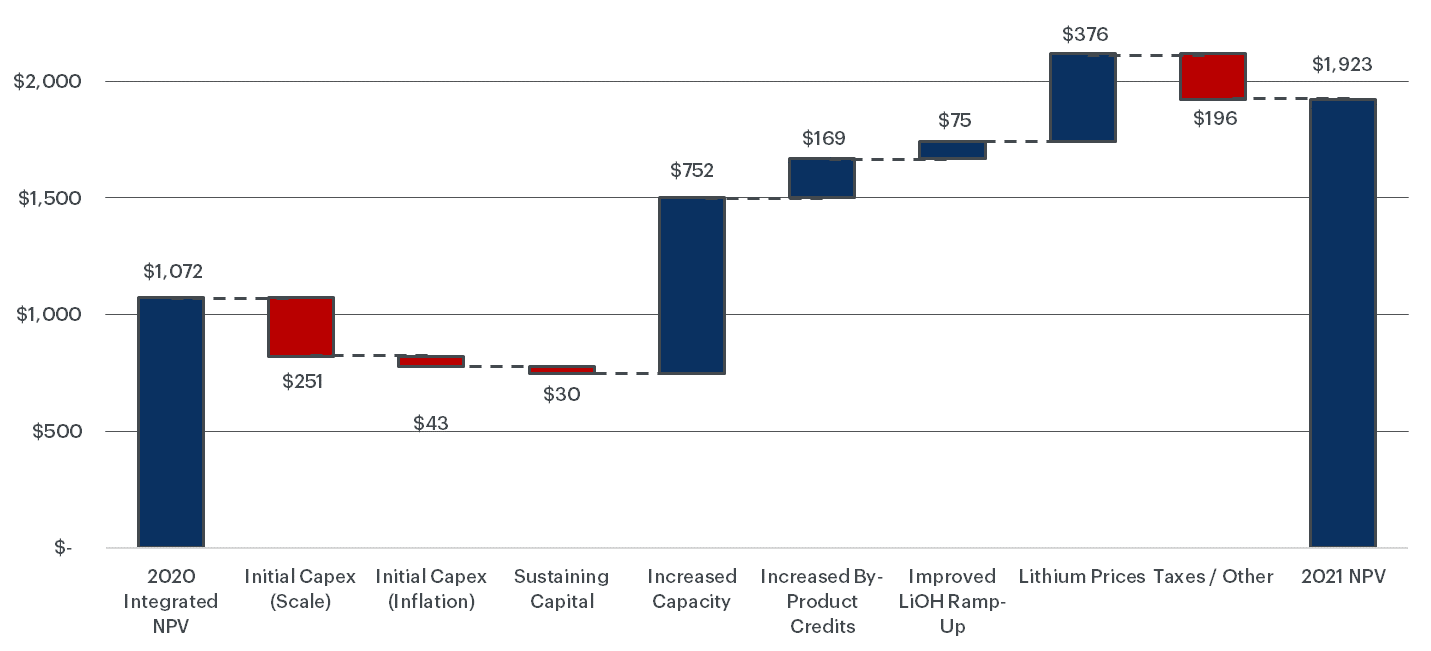
Figure 4 shows the impact of key project changes to Project NPV.
Figure 4 – Updated economic model impact to NPV8 on the Carolina Lithium Project (US$ Billion)
These improved results for the proposed operations have been achieved based on changes to the project design:
Production values have been modified
Run-of-mine ore production increased to 1.95Mt/y from 1.15 Mt/y
SC6 production increased to 248,000 t/y from 160,000 t/y
LiOH production increased to 30,000 t/y from 22,720 t/y
Quartz production increased to 252,000 t/y from 86,000 t/y
Feldspar production increased to 392,000 t/y from 125,000 t/y
Mica production increased to 70,000 t/y from 13,000 t/y
Product pricing has been updated to 2021 long-term forecasts for LiOH, SC6, and by-products
Environment, Sustainability, and Governance
Over the past year, the Company has taken steps to improve upon the advantages present in North Carolina. Minviro, an industry-leading practitioner of Life Cycle Assessment (LCA) impacts of manufacturing battery materials was engaged by Piedmont to complete a prospective LCA of the integrated lithium hydroxide operations. Together with Minviro, Piedmont has enhanced our sustainability footprint by implementing the following initiatives in our Study update:
Working with a solar developer to build and operate a solar farm on Piedmont property capable of producing electricity to supply up to 100% of Piedmont needs
Utilizing electric equipment to the greatest extent possible including transporting ore from pit operations to the concentrator to reduce fossil fuel consumption
Co-locating all operations on the same proposed site in Gaston County minimizing any transit and allowing unused by-products streams to be repurposed for site redevelopment
Expanding the by-products operations to serve valuable markets for quartz, feldspar and mica
Minviro worked with Piedmont to identify areas for improvement in operations on a cradle-to-gate basis using the work that Piedmont completed in prior studies. Piedmont is now setting a target to produce lithium hydroxide with a carbon intensity of less than 9 kg of CO2-e/Kg of lithium hydroxide including complete Scope 1, 2 and upstream Scope 3 emissions. This target is nearly half of the carbon intensity of incumbent producers of lithium hydroxide starting with spodumene mined in Western Australia and chemically refined in China. It is on par with brine-based production routes to lithium hydroxide which require considerable quantities of reagents to be transported by ocean going vessels and supplies of fresh water in a water scarce region.
Scoping Study Consultants
This Scoping Study update combines information and assumptions provided by a range of independent consultants, including the following consultants who have contributed to key components of the Study.
Table 3: Scoping Study Consultants
Consultant
Scope of Work
Primero Group Limited
Concentrate operations and overall Study integration
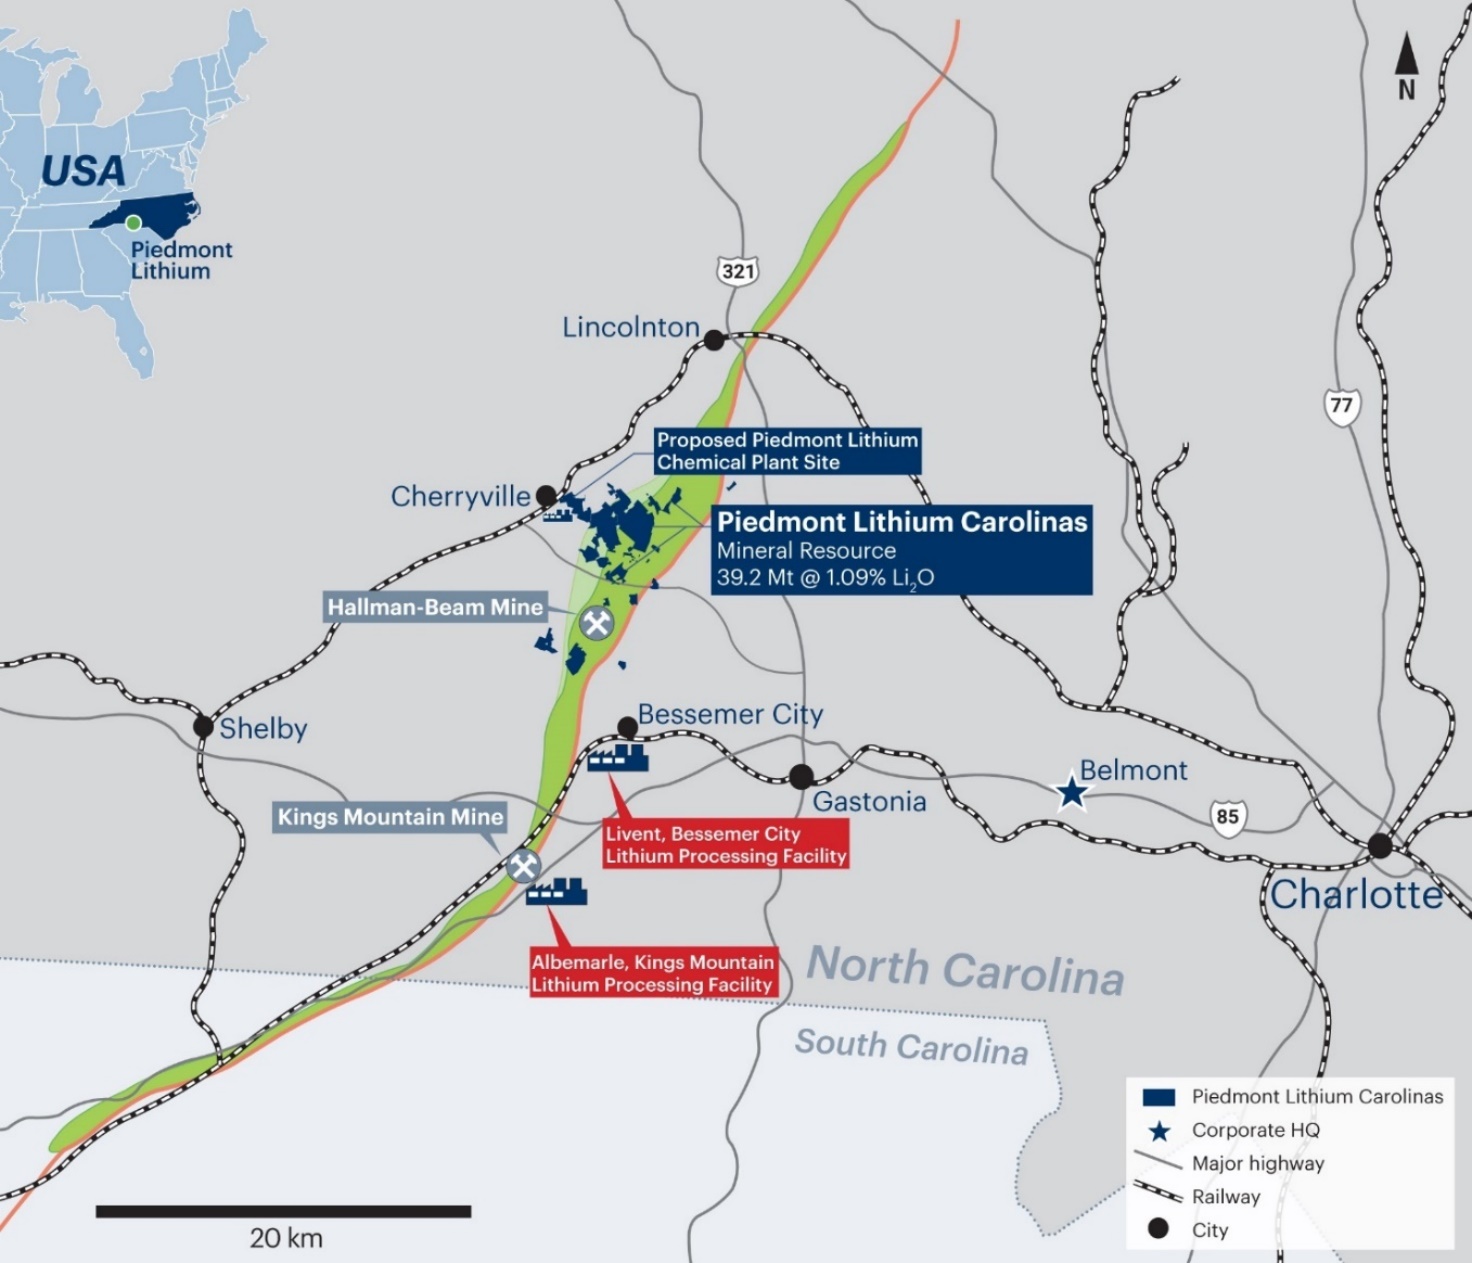
Piedmont holds a 100% interest in the Carolina Lithium Project located within the Carolina Tin-Spodumene Belt (“TSB”) and along trend to the Hallman Beam and Kings Mountain mines, which historically provided most of the western world’s lithium between the 1950s and the 1980s. The TSB has been described as one of the largest hard rock lithium regions in the world and is located approximately 25 miles west of Charlotte, North Carolina.
The Company has reported Mineral Resource estimates (“MRE”) for the Project. Piedmont has completed 495 drill holes on these properties totaling 82,924 meters to date spanning four drill campaigns.
As of March 31, 2021, the Project comprised approximately 2,667 acres of surface property and associated mineral rights, of which approximately 988 acres are owned, approximately 113 acres are subject to long-term lease, approximately 79 acres are subject to lease-to-own agreements, and approximately 1,487 acres are subject to exclusive option agreements. These exclusive option agreements, upon exercise, allows Piedmont to purchase or, in some cases, enter into long-term lease agreements for the surface property and associated mineral rights.
Figure 5 – Piedmont’s location within the TSB
Mineral Resource Estimates
On April 8, 2021 the Company announced an updated MRE prepared by independent consultant McGarry Geoconsulting Corp. (“McGarry Geo”) in accordance with JORC Code (2012 Edition). The total lithium Mineral Resources reported by Piedmont for the Carolina Lithium Project are 39.2 Mt grading at 1.09% Li2O.
Table 4: Piedmont Carolina Lithium Mineral Resources Estimate
Resource Category
Tonnes
(Mt)
Grade
(Li2O%)
Li2O
(t)
LCE
(t)
Indicated
21.6
1.12
241,000
597,000
Inferred
17.6
1.03
181,000
449,000
Total
39.2
1.09
422,000
1,046,000
On June 8, 2021 the Company announced updated MREs for by-products quartz, feldspar, and mica. The results are shown in Table 5. The by-product MRE’s have been prepared by independent consultants, McGarry Geo and are reported in accordance with the JORC Code (2012 Edition). The economic extraction of by-product minerals is contingent on Piedmont’s economic extraction of lithium Mineral Resources. Accordingly, the by-product Mineral Resource estimates are reported at a 0.4% Li2O cut-off grade, consistent with the reported lithium MRE.
Table 5: Mineral Resource Estimates – By-product Minerals
Category
Tonnes (Mt)
Li2O
Quartz
Feldspar
Mica
Grade (%)
Tonnes (t)
Grade (%)
Tonnes (Mt)
Grade (%)
Tonnes (Mt)
Grade (%)
Tonnes (Mt)
Indicated
21.6
1.12
241,000
29.4
6.34
45.0
9.69
4.2
0.90
Inferred
17.6
1.03
181,000
29.3
5.16
45.9
8.08
4.1
0.73
Total
39.2
1.09
422,000
29.4
11.50
45.4
17.77
4.2
1.63
Production Target
Pit optimizations were completed by Marshall Miller in order to produce a production schedule on an annual basis. This resulted in a total production target of approximately 4.96 Mt of 6.0% Li2O spodumene concentrate (“SC6”), averaging approximately 248,000 t/y of SC6 over the 20-year mine life. This equates to an average of 1.95 Mt/y of ore processed, totaling approximately 37.4 Mt of run-of-mine (“ROM”) ore at an average ROM grade of 1.09% Li2O (undiluted) over the 20-year mine life.
The Study assumes concentrate operations and chemical plant operations production life of 20 years, commencing in year 1 of the Project. It is assumed that concentrate operations including by-products will commence about 90 days in advance of chemical plant start-up to build initial SC6 inventory. SC6 produced in excess of chemical plant requirements are assumed to be sold to third parties during the life of the Project. Of the total production target of 4.96 Mt of SC6, approximately 1.19 Mt will be sold to third parties during the operational life and approximately 3.77 Mt will be supplied to Piedmont’s chemical plant operations for conversion into lithium hydroxide, resulting in a total production target of approximately 582,000 t of lithium hydroxide, averaging approximately 29,095 t/y of lithium hydroxide over the 20-year production life.
Of the 582,000 t lithium hydroxide production target 567,000 t are expected to be sold as battery-grade quality lithium hydroxide with 15,000 t sold as technical-grade quality based on the estimated ramp-up of the lithium chemical plant.
The Study assumes production targets of 4.83 Mt of quartz concentrate, 7.51 Mt of feldspar concentrate, and 1.34 Mt of mica concentrate over the life of operations based on the potential recovery of these products from the concentrator flotation circuits and the Company’s analysis of domestic industrial minerals markets and engagement with prospective customers.
There remains significant opportunity to increase the operational life of Carolina Lithium beyond 20 years by discovery of additional resources within the TSB within a reasonable trucking or conveying distance to the proposed concentrator.
Mining
Independent consultants Marshall Miller and Associates used SimSched™ software to generate a series of economic pit shells using the updated Mineral Resource block model and input parameters as agreed by Piedmont. Overall slope angles in rock were estimated following a preliminary geotechnical analysis that utilized fracture orientation data from oriented core and downhole geophysics (Acoustic Televiewer), as well as laboratory analysis of intact rock strength. The preliminary geotechnical assessment involved both kinematic and overall slope analyses utilizing Rocscience™ modeling software.
Overall slope angles of 45 degrees were assumed for overburden and oxide material. Overall slope angles of 53 degrees were estimated for fresh material which includes a ramp width of 30 meters. Production schedules were prepared for the Project based on the following parameters:
A targeted run-of-mine production of 1.95 Mt/y targeting concentrator output of about 248,000 t/y of SC6
Mining dilution of 10%
Mine recovery of 100%
Concentrator processing recovery of 80%
Mine sequence targets maximized utilization of Indicated Mineral Resources at the front end of the schedule
The results reported are based upon a scenario which maximizes extraction of Indicated Resources in the early years of production. Indicated resources represent 100% of the tonnes processed in years 1-3 of operations. The results reported assume that the Core property is mined from year 1-17 with the Central property mined in years 17-19 and the Huffstetler property mined in years 19-20. Table 6 shows the production target.
Table 6: Total Production Target for Piedmont Properties
Property
ROM Tonnes Processed
(kt)
Waste Tonnes Mined
(kt)
Stripping Ratio
(W:O t:t)
ROM Li2O Diluted Grade
(% )
Production Years
Tonnes of SC6
(kt)
Core
30,593
378,603
12.4
0.99
1-17
4,050
Central
4,251
49,467
11.6
1.12
17-19
632
Huffstetler
2,564
28,511
11.1
0.81
19-20
278
Total
37,408
456,581
12.2
0.99
1-20
4,960
Concentrate Metallurgy
Piedmont engaged SGS Canada Inc. in Lakefield, Ontario to undertake testwork on variability and composite samples. Dense Medium Separation (“DMS”) and locked-cycle flotation tests produced high-quality spodumene concentrate with a grade above 6.0% Li2O, iron oxide below 1.0%, and low impurities from composite samples. Table 7 shows the results of composite tests on the preferred flowsheet which were previously announced on July 17, 2019. The feed grade of the composite sample was 1.11% Li2O.
This Study assumes a spodumene recovery of 80% when targeting a 6.0% Li2O spodumene concentrate product. The Company is currently undertaking additional variability sample testing concurrent with ongoing Definitive Feasibility Study (“DFS”) activities.
Table 7: Dense Medium Separation and Locked Cycle Flotation Test Concentrate Assays
Sample
Li2O
(%)
Fe2O3
(%)
Na2O
(%)
K2O
(%)
CaO+ MgO + MnO (%)
P2O5
(%)
Dense medium separation
6.42
0.97
0.56
0.45
0.51
0.12
Locked-cycle flotation
6.31
0.90
0.68
0.52
1.25
0.46
Combined concentrate
6.35
0.93
0.63
0.49
0.96
0.32
By-Product Metallurgy
The production of bulk quartz and feldspar concentrates as by-products from the spodumene locked-cycle flotation tailings was investigated. Six individual batch tests were conducted with the quartz and feldspar concentrates being composited. The results of these tests are provided in Table 8 (results previously announced May 13, 2020). Additional by-product testwork in conjunction with DFS is ongoing.
Piedmont engaged North Carolina State University’s Minerals Research Laboratory in 2018 to conduct bench-scale testwork on samples obtained from the Company’s MRE within the Core Property for by-products quartz, feldspar, and mica. The objective of the testwork program was to develop optimized conditions for spodumene flotation and magnetic separation for both grade and recovery. Summary mica concentrate data are shown in Table 9. Complete mica data were previously announced on September 4, 2018. Further mica product optimization is in progress in conjunction with the DFS.
Mica quality is measured by its physical properties including bulk density, grit, color/brightness, and particle size. The bulk density of mica by-product generated from Piedmont composite samples was in the range of 0.680 – 0.682 g/cm3.
The National Gypsum Grit test is used mostly for minus 100 mesh mica which issued as joint cement compound and textured mica paint. Piedmont sample grit results were in the range of 0.70 – 0.79%, well below the typical specification for total grit in mica of 1.0%. Color/brightness is usually determined on minus 100 mesh material. Several instruments are used for this determination including the Hunter meter, Technedyne and the Photovoltmeter. The green reflectance is often reported for micas and talcs. Piedmont Green Reflectance results were in the range of 11.2 – 11.6.
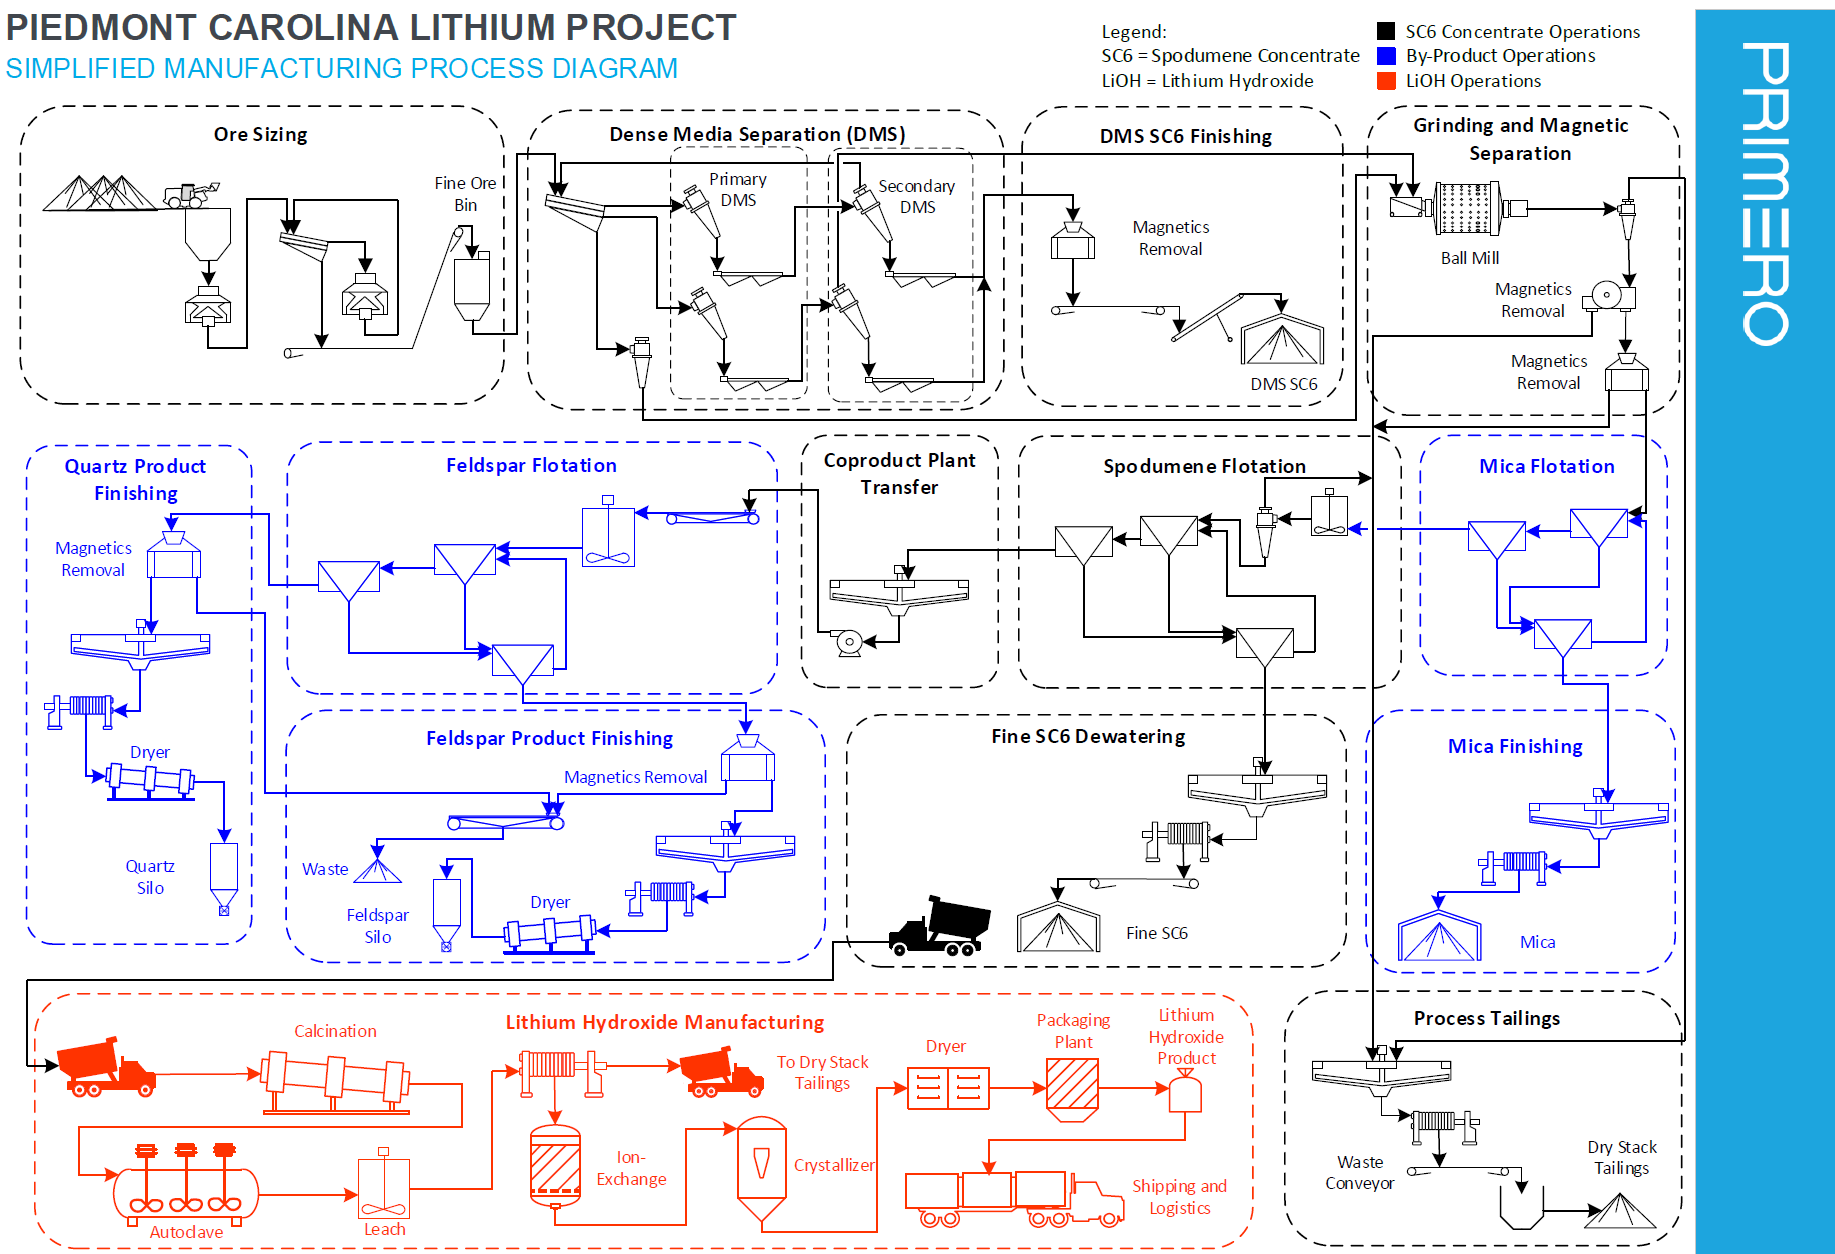
Process Design
The concentrator process design is based on prior SGS testwork. Flowsheet optimization is ongoing with a variability testwork program at SGS in conjunction with the Company’s definitive feasibility study. Lithium hydroxide manufacturing process design is based on Metso Outotec experience. A pilot-scale testwork program is currently underway to confirm process design as part of the Company’s ongoing definitive feasibility study.
The simplified process flow diagram for the Project is shown in Figure 6.
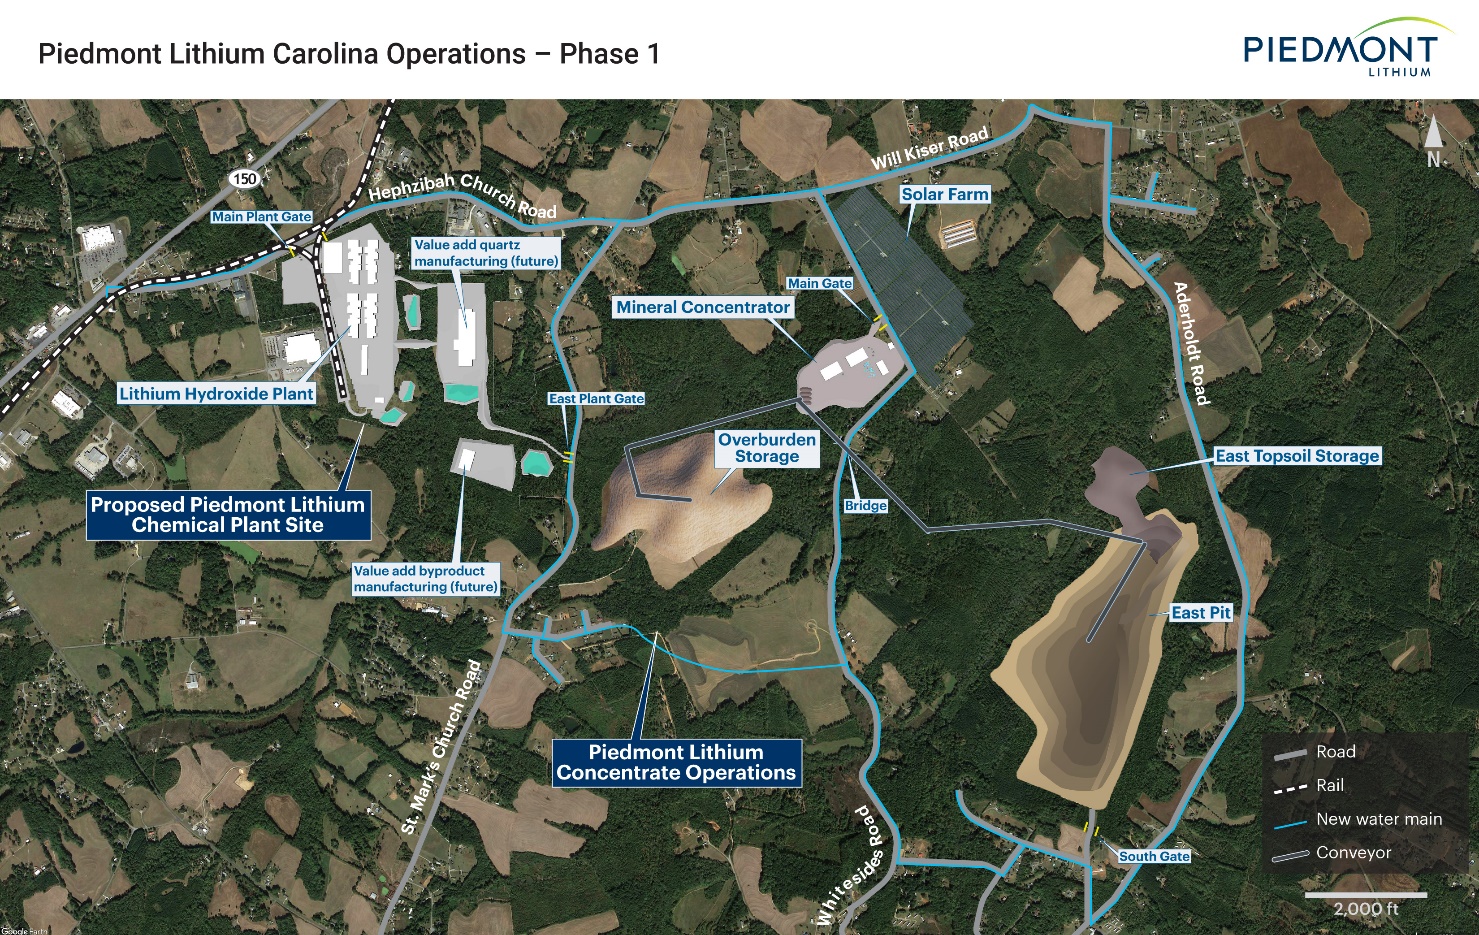
A preliminary integrated site plan including mining operations, concentrate operations, lithium hydroxide manufacturing, overburden and waste rock disposal, by-product manufacturing and ancillary facilities was developed by Marshall Miller and Primero Group during the course of study. Figure 7 shows the indicative site plan for the proposed integrated manufacturing campus.
Figure 7 – Proposed integrated manufacturing campus site plan
Infrastructure
Piedmont enjoys a superior infrastructure position relative to most lithium projects globally. The proposed site is approximately 25 miles west of Charlotte, North Carolina. The site is directly accessible by multiple state highways, CSX railroad, and is in close proximity to U.S. Highway 321 and U.S. Interstate I-85.
Piedmont’s proposed Carolina Lithium operations are in proximity to four (4) major US ports:
Charleston, SC – 197 miles
Wilmington, NC – 208 miles
Savannah, GA – 226 miles
Norfolk, VA – 296 miles
Charlotte-Douglas International Airport is 20 miles from the proposed operations. Charlotte-Douglas is the 6th largest airport in the United States and has direct international routes to Canada, the Caribbean, South America, and Europe.
Temporary or permanent camp facilities will not be required as part of the Project. Furthermore, Livent Corporation and Albemarle Corporation operate lithium chemical plants in close proximity to the proposed Piedmont operations, and the local region is well serviced by fabrication, maintenance, and technical service contractors experienced in the sector.
Logistics
Most spodumene concentrate produced by Piedmont will be consumed by the Piedmont Carolina Lithium chemical plant. For internal transportation costs within the integrated campus a US$2.00/t cost is included in the financial model for the internal site transport between the concentrate operations and chemical plant.
Permitting
HDR Engineering has been retained by Piedmont to support permitting activities on the proposed Project.
In November 2019, the Company received a Clean Water Act Section 404 Standard Individual Permit from the US Army Corps of Engineers for the concentrate operations. This is the only federal permit required for the concentrate operations. The Company has also received a Section 401 Individual Water Quality Certification from the North Carolina Division of Water Resources.
The concentrate operations require a North Carolina State Mining Permit from the North Carolina Department of Environmental Quality (“NCDEQ”) Division of Energy, Mineral and Land Resources. A permit application is well advanced and will be submitted to North Carolina following additional pre-application consultation over the coming months.
Piedmont previously received a Clean Air Act Title V synthetic minor permit from the NCDEQ Division of Air Quality for a proposed lithium hydroxide operation in Kings Mountain. Piedmont will apply for a new Title V synthetic minor air permit for the proposed Gaston County chemical plant location in the coming months.
The overall proposed integrated Project remains subject to conditional district rezoning within Gaston County. A rezoning application will proceed following additional pre-application consultation with Gaston County and community leaders following publication of the Study results.
Marketing
Lithium Market Outlook
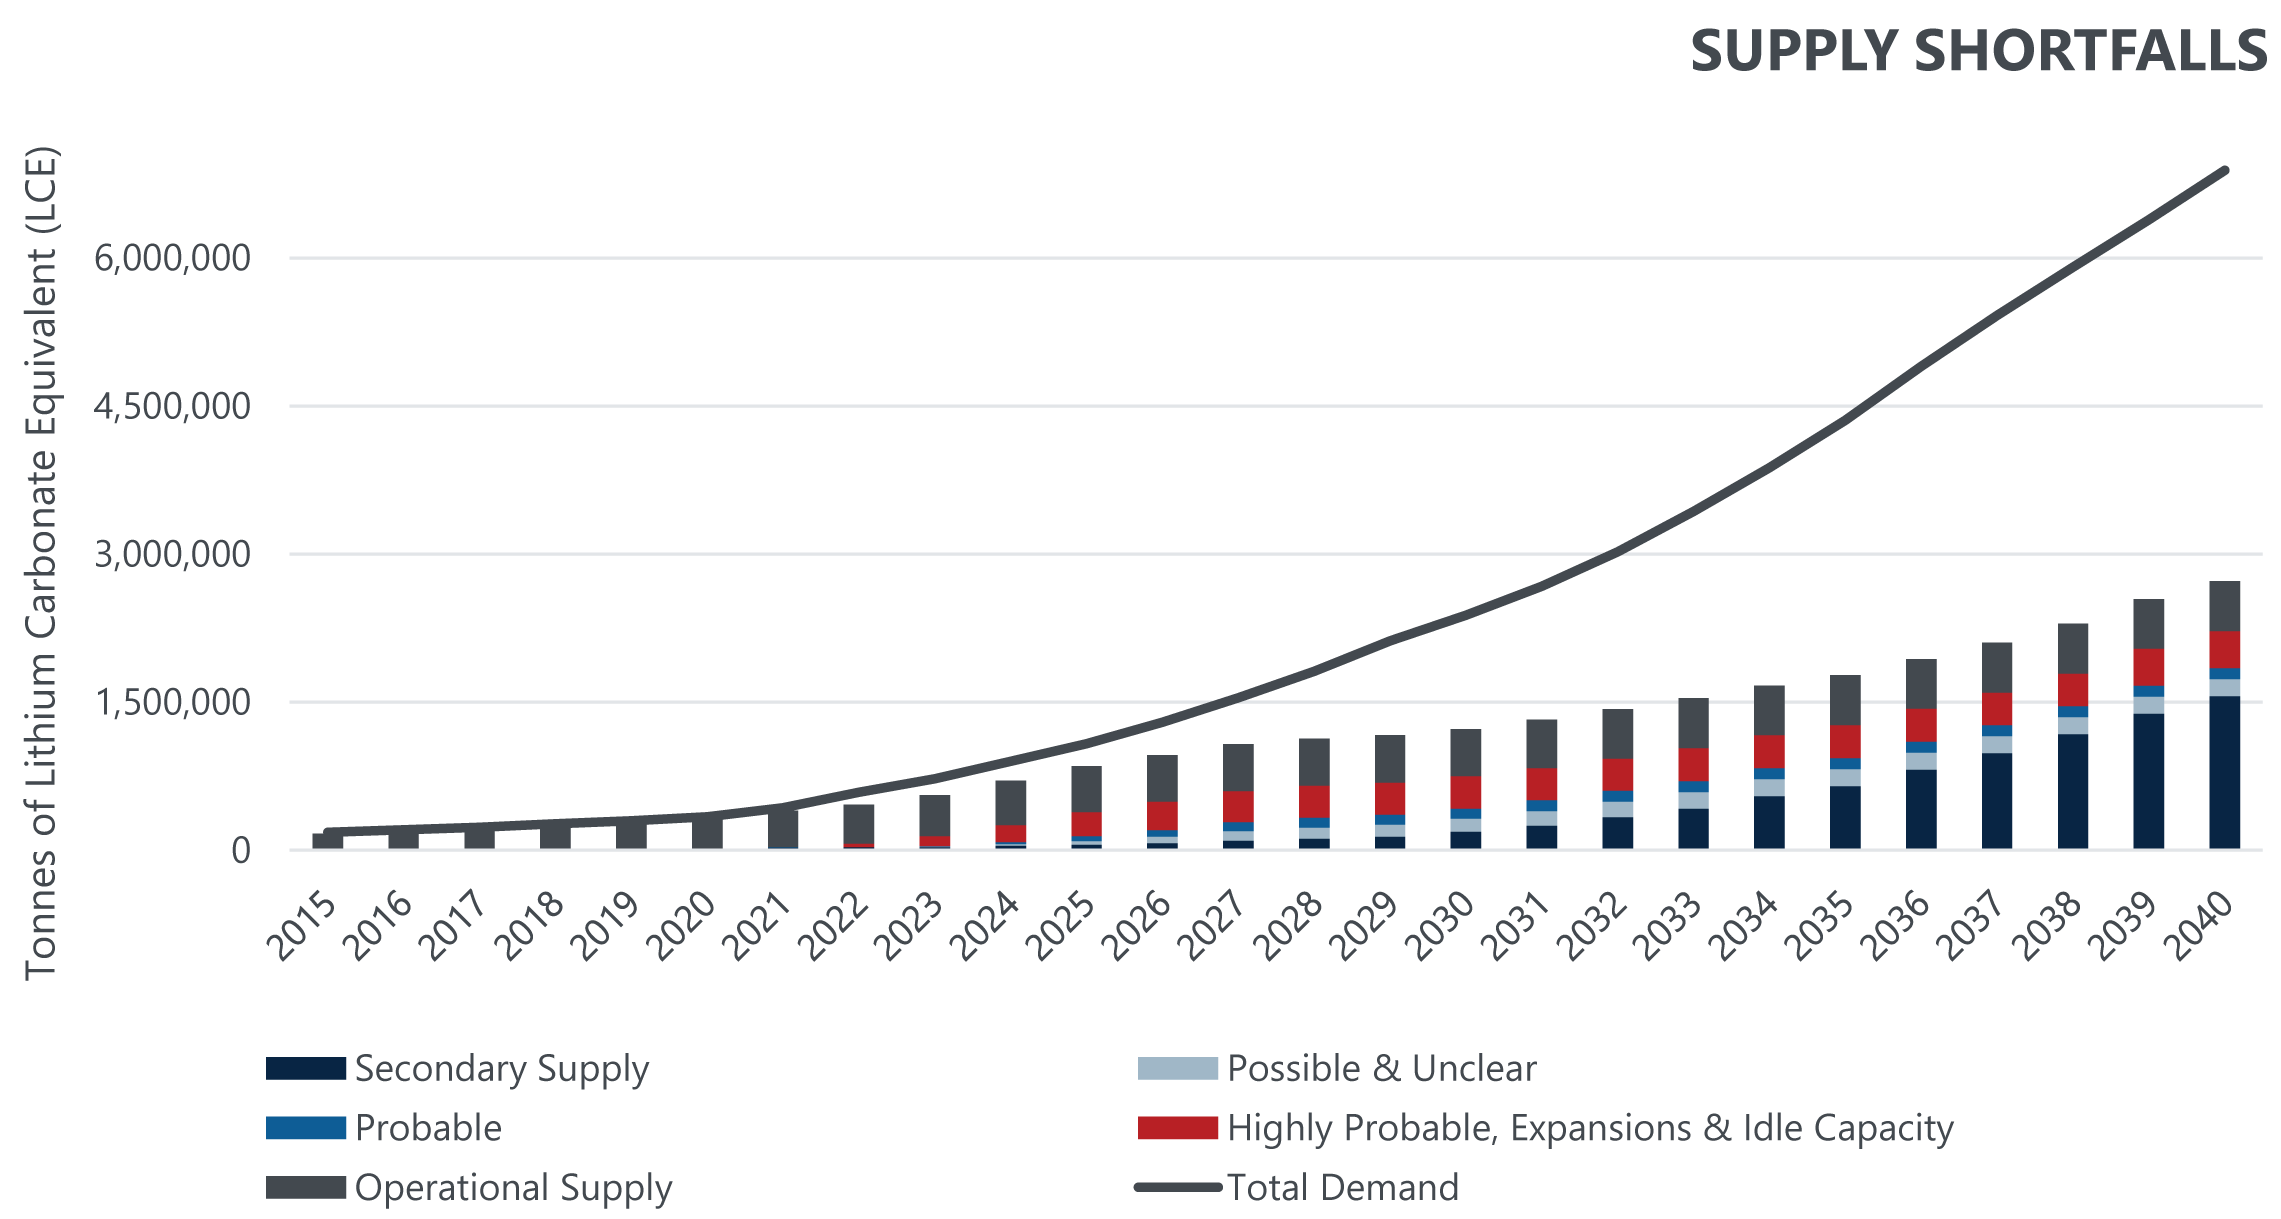
Benchmark Mineral Intelligence (“Benchmark”) reports that total battery demand will grow to 312 GWh in 2021 translating to 297kt of LCE demand in 2021, a growth of 41% over 2020 demand. Benchmark forecasts total demand in 2021 to be 430kt on an LCE basis.
Benchmark further expects the market to remain in a structural deficit for the foreseeable future as demand gets a head-start on supply. In the near impossible scenario that all projects come online on time as planned and without any issues, the first surplus will not occur until 2025. Benchmark believes that in this extreme case, a surplus could only be expected to last a few years before demand forces the market into a large deficit without further new projects yet undiscovered or developed.
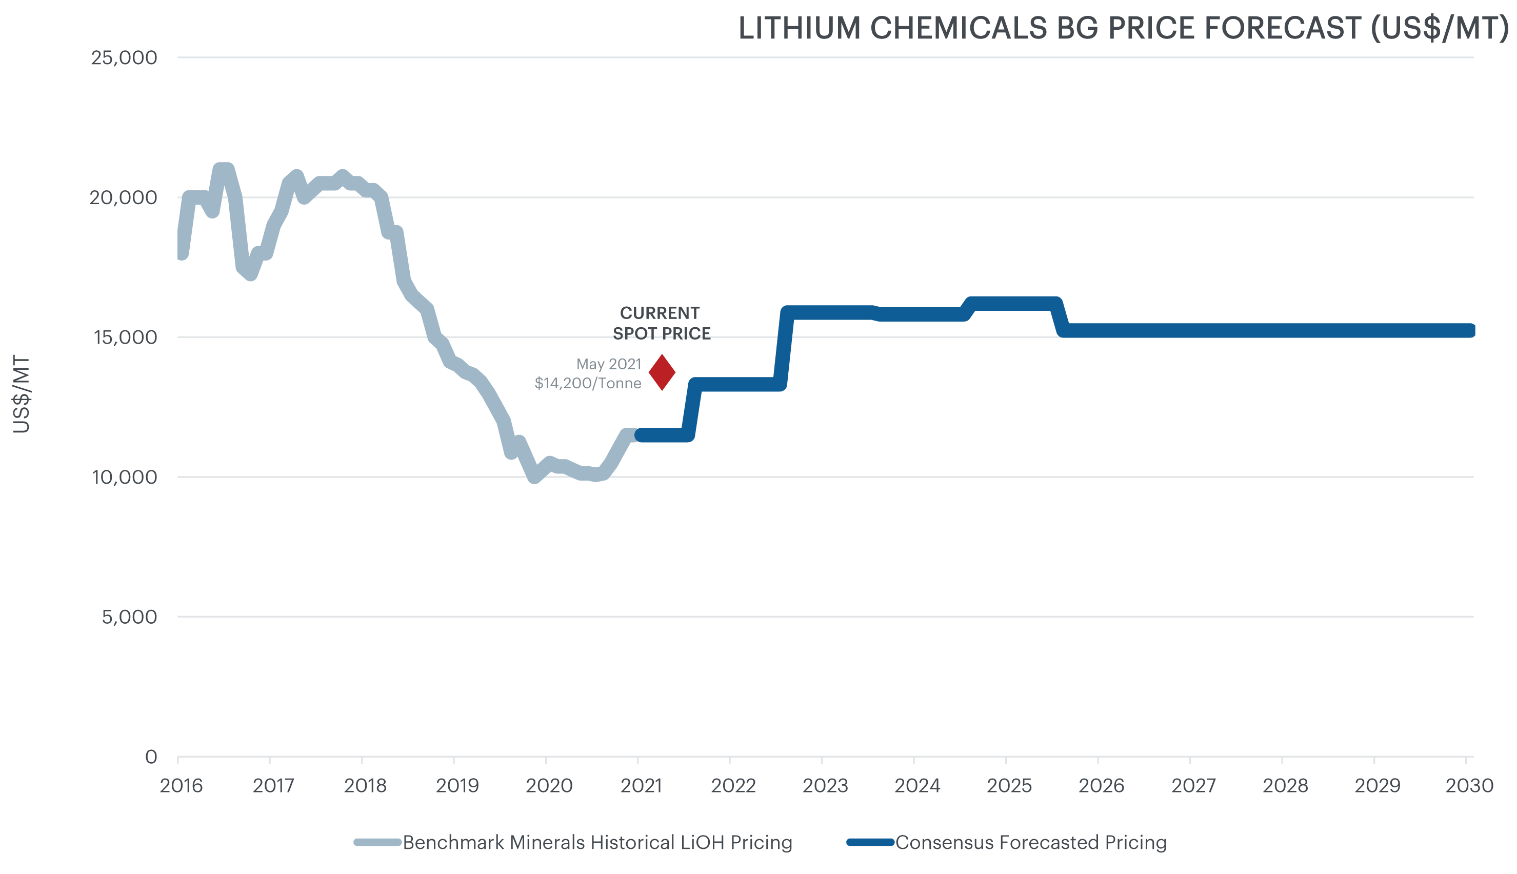
This Study assumes battery-grade lithium hydroxide and SC6 prices which reflect the median of consensus estimates from Benchmark Minerals, Roskill, Canaccord, Evercore, JPMorgan and Macquarie for the 2022-2026 period with fixed long-term pricing of $15,239/t for lithium hydroxide and $762/t for spodumene concentrate from 2027 onwards.
Piedmont is focused on establishing strategic partnerships with customers for battery grade lithium hydroxide with an emphasis on a customer base which is focused on EV demand growth in North America and Europe. Piedmont will concentrate this effort on these growing EV supply chains, particularly in light of the growing commitments of battery manufacturing by groups such as Ford, General Motors, LGES, Northvolt, SK Innovation, Volkswagen and others. Advanced discussions with prospective customers are ongoing.
By-Product Marketing
Piedmont proposes to produce quartz, feldspar and mica as by-products of spodumene concentrate operations. The Company engaged John Walker, an independent consultant, and Pronto Minerals, a joint venture between the Company and Ion Carbon & Materials, to assist the Company in estimating market opportunities for its by-products as shown in Table 10 below.
Table 10: Market Forecasts and Basket Pricing for By-Products (US$/t)
Quartz (t/y)
Feldspar (t/y)
Mica(t/y)
Average Realized Price ($/t) Mine Gate
252,000
392,000
69,700
$79.50
Operating Cost Estimate
Spodumene Concentrate Operating Cost Estimate
The SC6 operating cost estimate was prepared based on operating at approximately 1.95 million t/y run-of-mine ore producing an average of 248,000 t/y of SC6. Table 11 summarizes the estimated operating costs at steady-state. Costs are presented on an FOB chemical plant basis. Calcium carbonate and aluminosilicate by-products from lithium hydroxide manufacturing are assumed to have zero credit value.
The operating cost estimate was prepared based on producing 30,000 t/y of lithium hydroxide monohydrate. Table 12 summarizes the estimated average operating costs over life-of-mine.
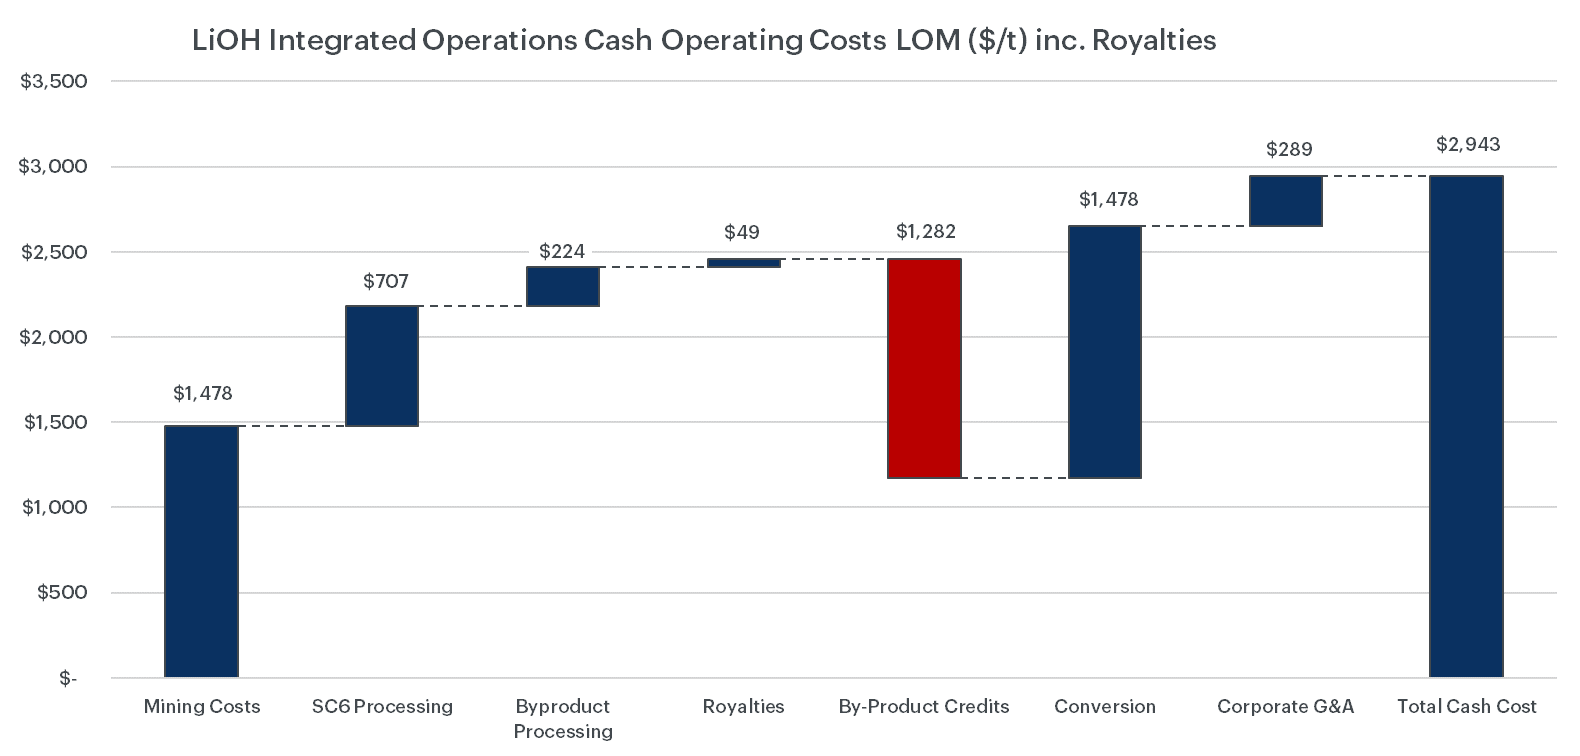
Table 12: Chemical Plant Cash Operating Cost Summary
Operating Cost Component
Total Average Annual Cost (US$MM/y)
Cost US$/t LiOH
Salaries
$9.3
$317
Reagents
$19.0
$656
Consumables
$1.0
$35
Utilities
$7.4
$254
Maintenance
$3.5
$122
Water and wastewater treatment
$1.0
$33
Chemical plant overheads
$1.8
$61
Subtotal conversion costs
$43.0
$1,478
SC6 supply costs (cash cost basis)
$34.2
$1,176
Corporate G&A
$8.0
$289
Total cash operating costs
$85.2
$2,943
The operating cost estimate is based on 2021 U.S. dollars with no escalation. Target accuracy of the operating cost estimate is ± 35%. Operating costs are based on steady-state production. The average operating costs include the commissioning and ramp-up phases of both concentrate operations and chemical plant operations. Third party SC6 sales are not included in the by-product credits.
Figure 10 – Lithium hydroxide production average life-of-mine cash operating cost
Capital Cost Estimate
Table 13 highlights the total estimated capital expenditures for the Project. A 20% contingency has been carried on costs in the economic modelling of the Project except where contracted values, such as land expenses, have been defined.
Table 13: Estimated Capital Costs
Cost Center
Life-of-mine total (US$ million)
Mine establishment and infrastructure direct costs
$67.0
In-pit crushing and conveyors
$52.1
Spodumene concentrator
$115.2
By-products plant
$39.0
Chemical plant
$277.3
Project indirects
$88.4
Total
$639.0
Land acquisition
$28.0
Other owner’s costs
$43.8
Total Initial Capital (Excluding Contingency)
$710.8
Contingency
$127.8
Total Development Capital
$838.6
Deferred and sustaining capital
$337.9
Working capital
$48.3
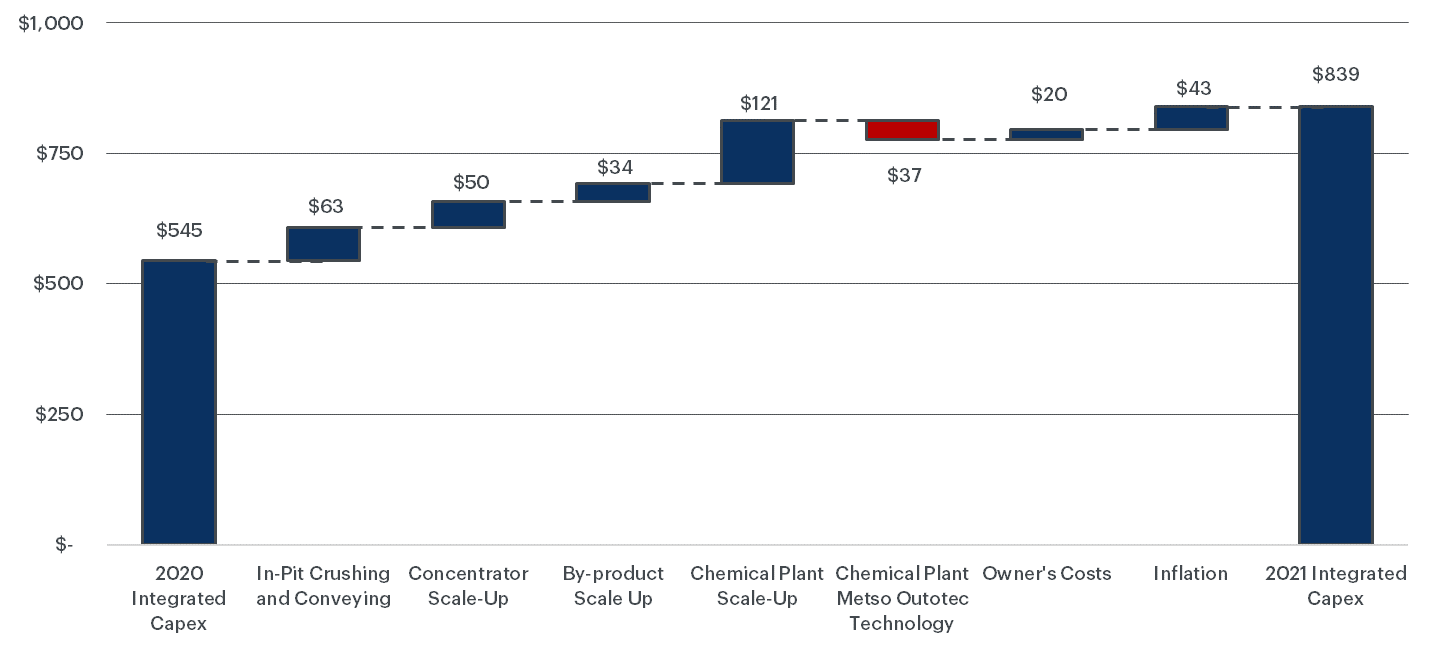
Figure 11 illustrates the change in capital costs from May 2020 to June 2021 including capital costs attributable to increased production rate, scope changes including adaptation of in-pit crushing and conveyor systems to improve operating costs and reduce environmental impacts, and inflationary impacts.
Figure 11 – Change in estimated project capital cost due to project scale, ESG initiatives, and inflation adjustment
Project Schedule
A preliminary schedule was prepared as part of the Study. At a scoping level of project detail, schedule development is limited to high level activities including feasibility study, detailed engineering, procurement of long lead items, critical contract formation and award, construction, and pre-operational testing activities. Key milestones are presented in Table 14. An updated schedule will be developed as part of the ongoing DFS.
The Scoping Study project economics include the following key parameters related to royalties, tax, depreciation, and depletion allowances.
Royalties of US$1.00 per ROM tonne based on the average land option agreement
North Carolina state corporate taxes are 2.5%
Federal tax rate of 21% is applied and state corporate taxes are deductible from this rate
Effective base tax rate of 22.975%
Depletion allowance of 22% is applied to the spodumene concentrate sales price
Depletion allowances for quartz, feldspar, and mica concentrates are assumed as 15%
Depreciation in the concentrate operations is based on Asset Class 10.0 – Mining in IRS Table B-1 using the general depreciation system (“GDS”) over 7 years with the double declining balance method
Depreciation in the chemical plant is based on Asset Class 28.0 – Mfg. of Chemical and Allied Products in Table B-1 using GDS of 5 years with the double declining balance method
Bonus depreciation of 80% has been applied based on the bonus depreciation allowance in the Tax Cuts and Jobs Act assuming a place in service date of the concentrate operations and chemical plant by December 31, 2023
Scoping Study Economics
Modeling Assumptions
A detailed project economical model was completed by the Company as part of the Study.
Capital and operating costs are in accordance with technical study outcomes
Chemical plant ramp-up is based on a 12-month time frame to nameplate production
Financial modeling has been completed on a monthly basis, including estimated cash flow for construction activities and project ramp-up.
Pricing information for battery-grade lithium hydroxide sales and spodumene concentrate supply are based on long-term forecasts using a basket of long-term forecasts provided by Benchmark, Roskill Canaccord, Evercore, JPMorgan and Macquarie
Royalties, tax, depreciation, and depletion allowances according to stated assumptions
Financial Modelling
A comprehensive economic model has been prepared which fully integrates the Piedmont Carolina Lithium Project including concentrate and chemical operations. The Study assumes a chemical plant production life of 20 years commencing 3 months after the start of mining operations. The mining production target is approximately 37.4 Mt at an average run of mine grade of 1.09% Li2O (undiluted) over a 20-year mine life. The overall project life is 20 years.
The current economic model is based on a monthly projection of capital costs and assumes that the full capital cost is spent across 21 months prior to commissioning of the concentrate operations and across 24 months prior to the commissioning of the chemical plant. Concentrate operations are assumed to ramp to full production over a one-year period and the chemical plant is also assumed to ramp to full production over a one-year period.
Payback Period
Payback periods for the Project constructed in a single phase is 2.9 years after the start of chemical plant operations or 4.9 years from the start of construction. Payback period is calculated on the basis of after-tax free cash flow.
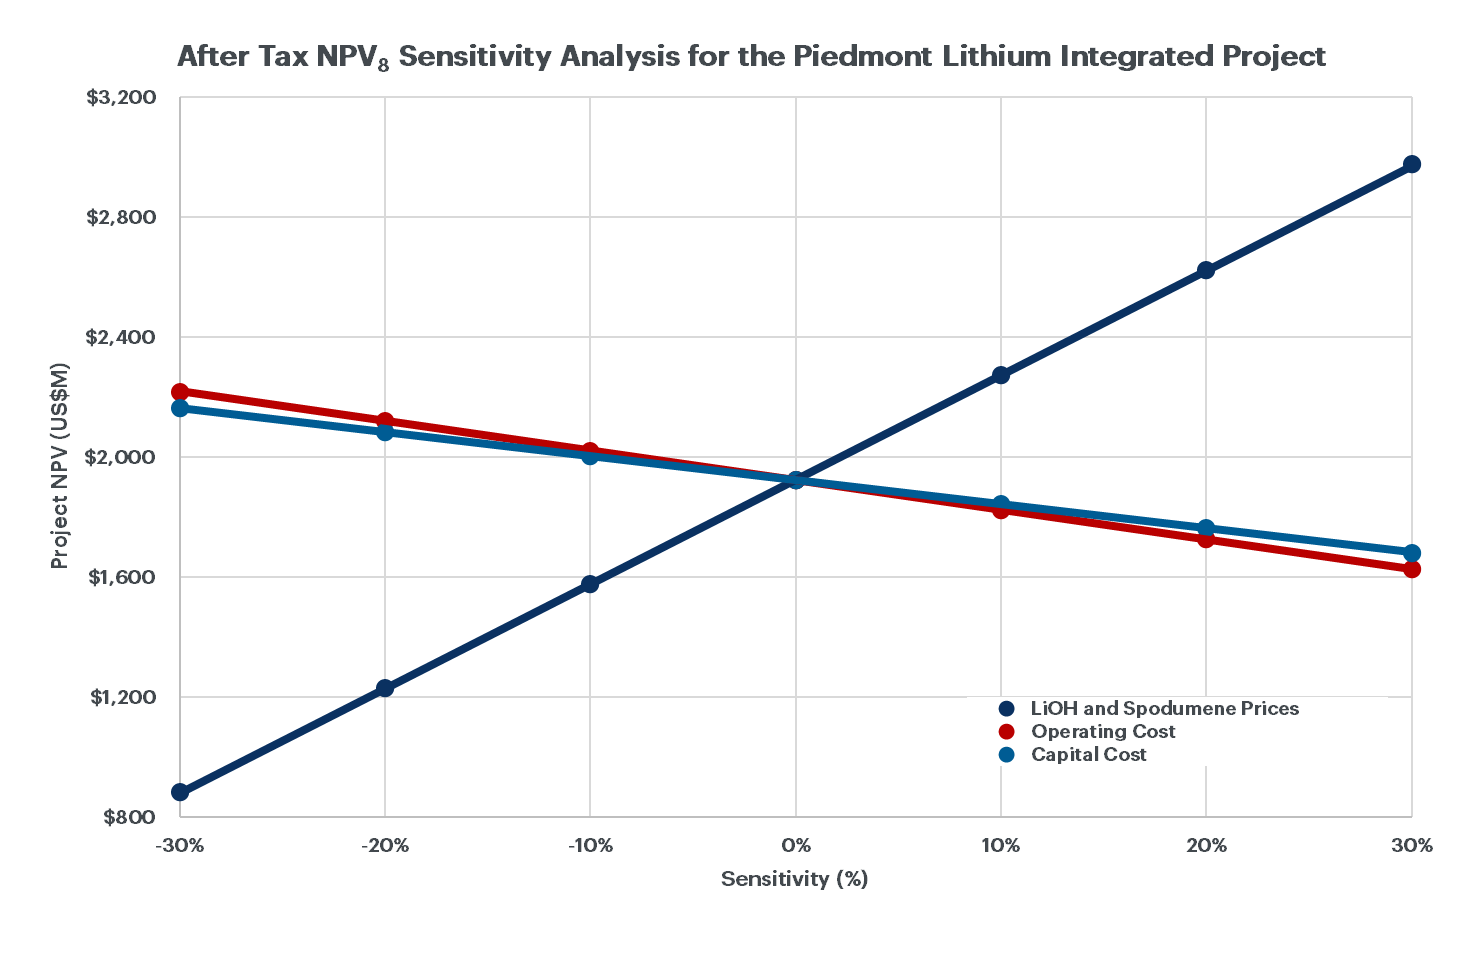
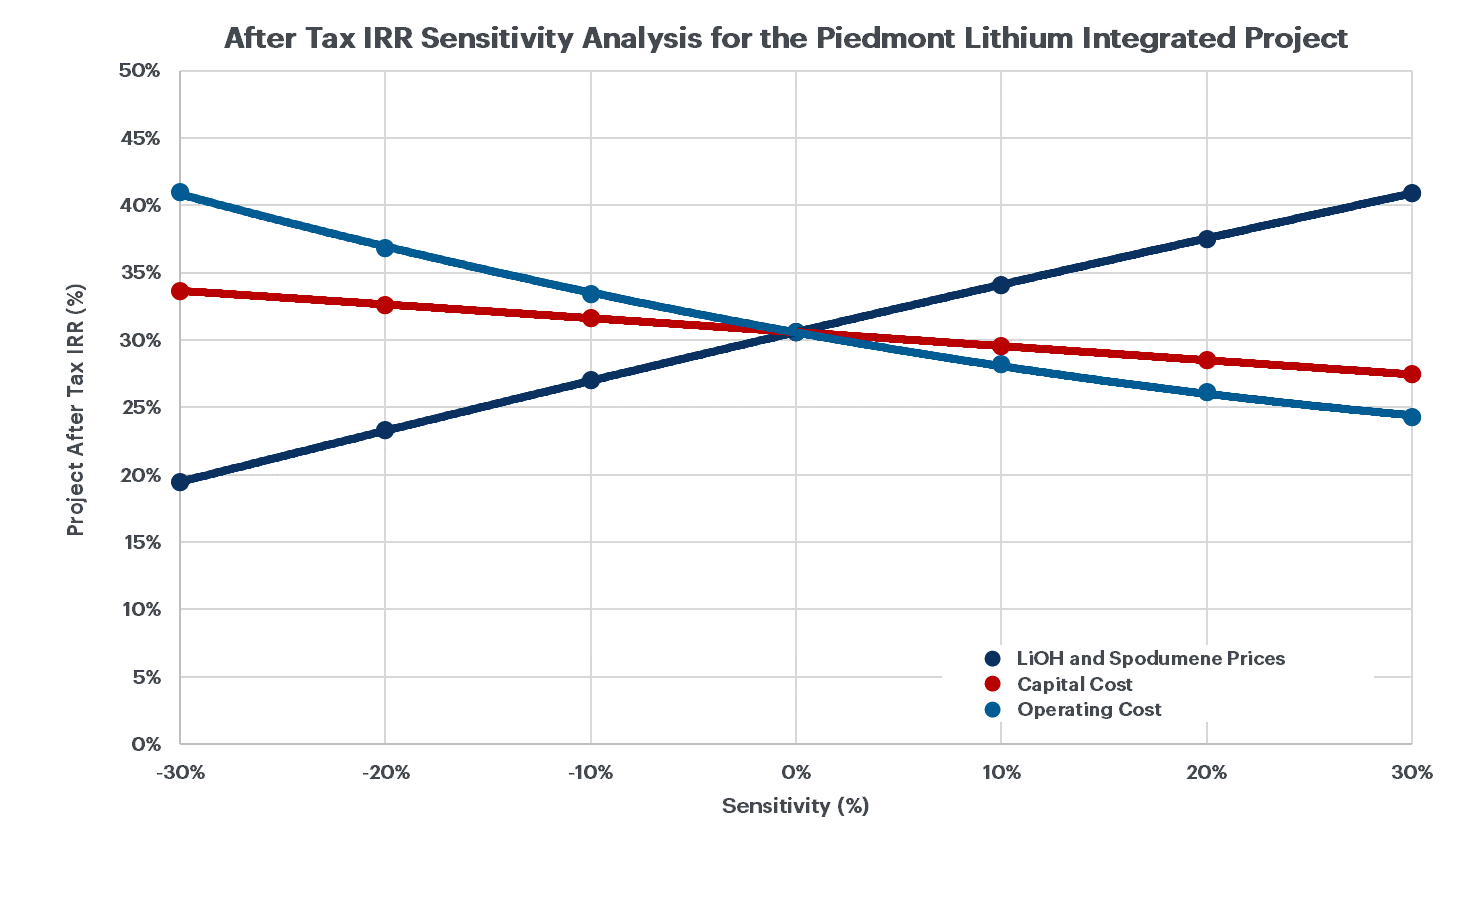
Sensitivity Analyses
The concentrate operations and chemical plant components of the Study have been designed to a Scoping level of detail with an intended accuracy of ± 35%. Key inputs into the Study have been tested by pricing, capital cost, and operating cost sensitivities (Figure 12 and Figure 13).
Figure 12 – Net present value sensitivity analysis for the Piedmont Carolina Lithium Project
Figure 13 – Internal rate of return sensitivity analysis for the Piedmont Carolina Lithium Project
Conclusions and Next Steps
The Study results demonstrate the potential for Piedmont to become a major North American lithium hydroxide producer on a fully integrated spodumene mine to lithium hydroxide chemical plant basis. The Company will now concentrate on the following initiatives to drive the Project forward:
Finalize the pilot scale lithium hydroxide conversion testwork currently underway with Metso Outotec
Conclude a definitive feasibility study of the Piedmont Carolina Lithium Project in 2021
Continue to build out the Company’s leadership team consistent with the efforts in 2021 to date
Engage in further pre-application consultation with Gaston County and the State of North Carolina in advance of submittal of rezoning and mine permit applications
Submit a new air permit application for the proposed 30,000 t/y Gaston County chemical plant
Evaluate strategic partnering options in partnership with Evercore and JP Morgan
Forward Looking Statements
This announcement may include forward-looking statements. These forward-looking statements are based on Piedmont’s expectations and beliefs concerning future events. Forward looking statements are necessarily subject to risks, uncertainties and other factors, many of which are outside the control of Piedmont, which could cause actual results to differ materially from such statements. Piedmont makes no undertaking to subsequently update or revise the forward-looking statements made in this announcement, to reflect the circumstances or events after the date of that announcement.
Cautionary Note to United States Investors Concerning Estimates of Measured, Indicated and Inferred Mineral Resources
The information contained herein has been prepared in accordance with the requirements of the securities laws in effect in Australia, which differ from the requirements of United States securities laws. The terms “mineral resource”, “measured mineral resource”, “indicated mineral resource” and “inferred mineral resource” are Australian mining terms defined in accordance with the 2012 Edition of the Australasian Code for Reporting of Exploration Results, Mineral Resources and Ore Reserves (the “JORC Code”). Comparable terms are now also defined by the U.S. Securities and Exchange Commission (“SEC”) in its newly adopted Modernization of Property Disclosures for Mining Registrants as promogulated in its S-K 1300 standards. While the guidelines for reporting mineral resources, including subcategories of measured, indicated, and inferred resources, are largely similar for JORC and S-K 1300 standards, documentation is ongoing with respect to the S-K 1300 Technical Report Summary template to formally categorize Piedmont’s mineral holdings as both JORC and S-K 1300 compatible. While the competent persons responsible for this announcement do not foresee any challenges in categorizing the resources delineated in this announcement as S-K 1300 compliant, information contained herein that describes Piedmont’s mineral deposits is not fully comparable to similar information made public by U.S. companies subject to reporting and disclosure requirements under the U.S. federal securities laws and the rules and regulations thereunder. U.S. investors are urged to consider Piedmont’s disclosure in its SEC filings, copies of which may be obtained from Piedmont or from the EDGAR system on the SEC’s website at http://www.sec.gov/.
Competent Persons Statements
The information in this announcement that relates to Exploration Results is based on, and fairly represents, information compiled or reviewed by Mr. Lamont Leatherman, a Competent Person who is a Registered Member of the ‘Society for Mining, Metallurgy and Exploration’, a ‘Recognized Professional Organization’ (RPO). Mr. Leatherman is an employee of the Company. Mr. Leatherman has sufficient experience that is relevant to the style of mineralization and type of deposit under consideration and to the activity being undertaken to qualify as a Competent Person as defined in the 2012 Edition of the ‘Australasian Code for Reporting of Exploration Results, Mineral Resources and Ore Reserves’. Mr. Leatherman consents to the inclusion in the report of the matters based on his information in the form and context in which it appears.
The information in this announcement that relates to lithium Mineral Resources is extracted from our announcement entitled “Piedmont Increases Lithium Resources by 40%” dated April 8, 2021. The information in this announcement that relates to by-product Mineral Resources is extracted from our announcement entitled “Piedmont Focused on Increased Sustainability with 40% Increase in Quartz, Feldspar, and Mica Mineral Resources” dated June 8, 2021. Both announcements are available to view on the Company website at www.piedmontlithium.com. Piedmont confirms that: a) it is not aware of any new information or data that materially affects the information included in the original announcements; b) all material assumptions and technical parameters underpinning the Mineral Resources in the original announcements continue to apply and have not materially changed; and c) the form and context in which the Competent Person’s findings are presented in this announcement have not been materially modified from the original announcements.
The information in this announcement that relates to Metallurgical Testwork Results is based on, and fairly represents, information compiled or reviewed by Dr. Jarrett Quinn, a Competent Person who is a Registered Member of Ordre des Ingénieurs du Québec’, a ‘Recognized Professional Organization’ (RPO). Dr. Quinn is consultant to Primero Group. Dr. Quinn has sufficient experience that is relevant to the style of mineralization and type of deposit under consideration and to the activity being undertaken to qualify as a Competent Person as defined in the 2012 Edition of the ‘Australasian Code for Reporting of Mineral Resources and Ore Reserves’. Dr. Quinn consents to the inclusion in the report of the matters based on information in the form and context in which it appears.
The information in this announcement that relates to Process Design, Capital Costs, and Operating Costs is based on, and fairly represents, information compiled or reviewed by Mr. Alexandre Roy, a Competent Person who is a Registered Member of ‘Ordres des Ingenieurs du Quebec’, a ‘Recognized Professional Organization’ (RPO). Mr. Roy is a full time employee of Primero Group. Mr. Roy has sufficient experience that is relevant to the style of mineralization and type of deposit under consideration and to the activity being undertaken to qualify as a Competent Person as defined in the 2012 Edition of the ‘Australasian Code for Reporting of Mineral Resources and Ore Reserves’. Mr. Roy consents to the inclusion in this report of the matters based on his information in the form and context in which it appears.
The information in this announcement that relates to Mining Engineering and Mining Schedule is based on information compiled by Mr. Chris Scott and reviewed by Dr. Steven Keim, both of whom are employees of Marshall Miller and Associates (MM&A). Dr. Keim takes overall responsibility as Competent Person for the portions of the work completed by MM&A. Dr. Steven Keim is a Competent Person who is a Registered Member of the ‘Society for Mining, Metallurgy & Exploration Society’, a ‘Recognized Professional Organization’ (RPO). Dr. Keim has sufficient experience, which is relevant to the style of mineral extraction under consideration, and to the activity he is undertaking, to qualify as Competent Person in terms of the JORC Code (2012 Edition). Dr. Keim has reviewed this document and consents to the inclusion in this report of the matters based on his information in the form and context within which it appears.
This announcement has been authorized for release by the Company’s CEO, Mr. Keith Phillips.
PIEDMONT FOCUSED ON INCREASED SUSTAINABILITY WITH 40% INCREASE IN QUARTZ, FELDSPAR, AND MICA MINERAL RESOURCES
Mineral Resource estimates have increased by 40% for quartz (11.5Mt), feldspar (17.8Mt), and mica (1.6Mt)
Piedmont has added John Walker, former CEO of The Quartz Corp, as a strategic advisor to the Company
Market analysis indicates far greater potential demand for Piedmont industrial mineral products than prior Company estimates
The Company is advanced in discussions with prospective regional customers and strategic partners in the solar glass, engineered quartz, ceramic tile, and other industrial minerals markets
Expanded quartz, feldspar, and mica production will feature in the Company’s upcoming technical studies
Piedmont Lithium Inc. (“Piedmont” or “Company”) is pleased to announce an updated Mineral Resource estimate for industrial mineral products quartz, feldspar, and mica. The estimate is based on the lithium Mineral Resource previously reported on April 8, 2021 (39.2Mt @ 1.09 Li2O%) for spodumene bearing pegmatites at the Company’s flagship Piedmont Carolina Lithium Project (“Project”) in North Carolina, USA.
Table 1: Mineral Resource Estimates for Industrial Minerals – Piedmont Carolina Lithium Project
Category
Tonnes (Mt)
Quartz
Feldspar
Mica
Grade
(%)
Tonnes
(Mt)
Grade
(%)
Tonnes
(Mt)
Grade
(%)
Tonnes
(Mt)
Indicated
21.6
29.4
6.34
45.0
9.69
4.2
0.90
Inferred
17.6
29.3
5.16
45.9
8.08
4.1
0.73
Total
39.2
29.4
11.50
45.4
17.77
4.2
1.63
To help advance the marketing of these mineral products, John Walker joined the Piedmont team last fall as a Strategic Consultant. John has extensive experience in the quartz and feldspar markets having worked with Imerys for more than twenty years and spending another eight years with The Quartz Corp as CEO. John has provided invaluable input on market dynamics, desired product quality and other customer criteria, allowing Piedmont to develop a robust business model for marketing these materials.
Keith D. Phillips, President and Chief Executive Officer, commented: “Piedmont continues to find increased value in our industrial mineral products quartz, feldspar, and mica. Our location in close proximity to potential customers helps advance our goal of becoming one of the world’s most sustainable lithium manufacturing businesses. Placing more of our valuable resources into the market creates circular economy opportunities through waste reduction while providing substantial credits towards our cost of lithium hydroxide production. Our upcoming technical studies are expected to demonstrate both the environmental and economic benefits that our team is creating through their ongoing efforts to make beneficial use of every part of our ore body.”
The quartz, feldspar, and mica Mineral Resource estimates (“MRE”), reported in Table 1, include an update for the Core property and an initial Mineral Resource estimate for the Central and Huffstetler properties. The details of the three MREs are summarized in Table 2. The mineral percentages for the MRE were derived from a normative mineralogical calculation using XRF major oxide analysis for spodumene bearing pegmatites within the current lithium Mineral Resource. Mineralogical results are similar for each of the Piedmont Carolina Lithium properties which illustrates the mineralogical consistency of the Carolina Tin-Spodumene Belt (“TSB”).
Table 2: Piedmont Carolina Lithium By-Product Quartz, Feldspar, and Mica Mineral Resources Estimates
Category
Deposit
Tonnes (Mt)
Li2O
Quartz
Feldspar
Mica
Grade
(%)
Tonnes (Mt)
Grade
(%)
Tonnes (Mt)
Grade
(%)
Tonnes (Mt)
Grade
(%)
Tonnes (Mt)
Indicated
Core
19.08
1.10
0.210
29.52
5.63
45.00
8.58
4.30
0.82
Central
2.47
1.30
0.030
28.79
0.71
45.16
1.12
3.24
0.08
Huffstetler
–
–
–
–
–
–
–
–
–
Total
21.55
1.12
0.241
29.42
6.34
44.97
9.69
4.18
0.90
Inferred
Core
12.61
1.03
0.130
29.27
3.69
45.80
5.78
4.28
0.54
Central
2.69
1.10
0.030
29.99
0.81
43.88
1.18
4.08
0.11
Huffstetler
2.31
0.91
0.021
28.82
0.67
48.60
1.12
3.24
0.08
Total
17.61
1.03
0.181
29.31
5.16
45.90
8.08
4.12
0.73
MRE Total
39.16
1.09
0.422
29.37
11.50
45.38
17.77
4.16
1.63
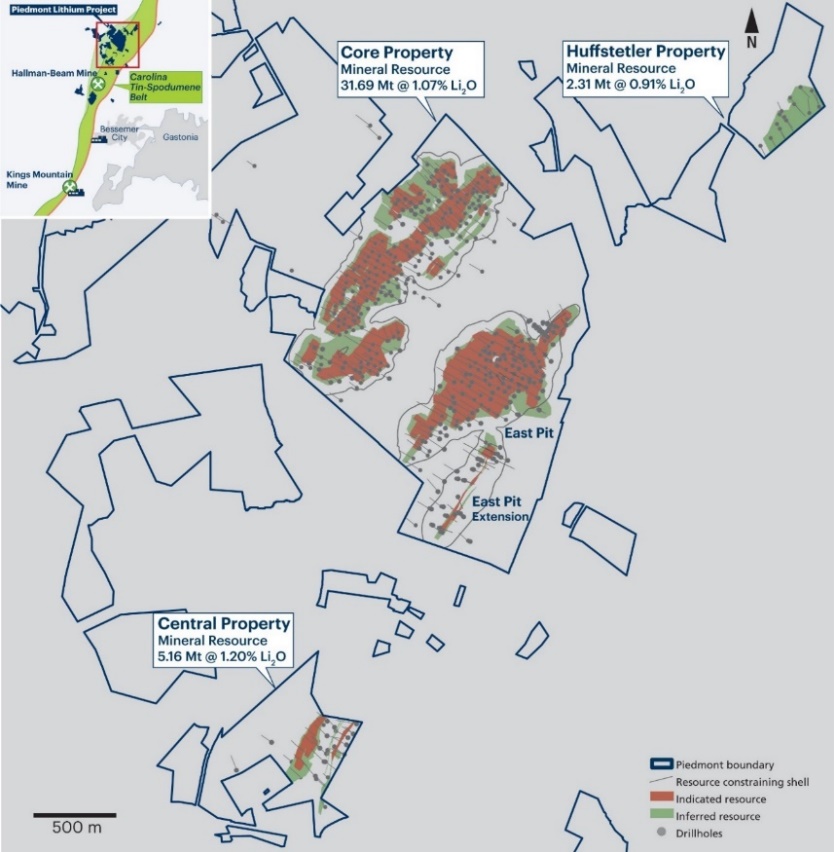
Central and Huffstetler properties are within one mile of the Core property along the trend of the TSB (Figure 1). Infill drilling continues on the Core property. These results will be used to update lithium and by-product Mineral Resources prior to completion of a Definitive Feasibility Study currently scheduled for September 2021.
showing updated MRE and resource constraining shells
Summary of Resource Estimate and Reporting Criteria
The resource has been prepared in compliance with JORC Code 2012 Edition and the ASX Listing Rules. The Company has included in Annexure A, the Table Checklist of Assessment and Reporting Criteria for the Piedmont Carolina Lithium Project as prescribed by the JORC Code 2012 Edition and the ASX Listing Rules.
The following is a summary of the pertinent information used in the MRE with the full details provided in Table 1 included as Appendix 1: JORC Table 1.
Geology and Geological Interpretation
Regionally, the Carolina Tin-Spodumene belt extends for 40 kilometers along the litho tectonic boundary between the Inner Piedmont and Kings Mountain belts. The mineralized pegmatites are thought to be concurrent and cross-cutting dike swarms extending from the Cherryville granite, as the dikes progressed further from their sources, they became increasingly enriched in incompatible elements such as lithium (Li) and tin (Sn). The dikes are considered to be unzoned.
On the property scale, spodumene pegmatites are hosted in a fine to medium grained, weakly to moderately foliated amphibolites and metasediments. The spodumene pegmatites range from fine grained (aplite) to very coarse-grained pegmatite with primary mineralogy consisting of spodumene, quartz, plagioclase, potassium-feldspar and muscovite.
Primary mineralogy and compositional averages for the modelled resource pegmatites are summarized in Table 2.
Table 3: Mineralogy and Compositional Averages for the Modelled Resource Pegmatites
Mineral
Compositional Average (%)
Core
Central
Huffstetler
Spodumene
13.6
16.7
11.8
Quartz
29.4
29.4
28.8
Albite (felsdpar)
35.7
35.6
36.4
K-spar (feldspar)
9.7
8.9
12.2
Muscovite (mica)
4.3
3.7
3.2
Biotite
1.9
1.6
3.4
Residual
5.5
4.1
4.1
Drilling and Sampling Techniques
These resources are an update to the initial by-product Mineral Resource estimates reported in August 2019 in which the resource was informed by 327 drillholes at the Core property. The current resource estimate is now informed by a total of 465 drillholes. Table 4 shows the allocation of drillholes per property.
Table 4: Drill Hole Summary for the Mineral Resource Estimate Update
Property
Drill Type
Number of
Holes
Number of
Holes with XRF data
Core
Diamond and Rotary Sonic Core
415
303
Central
Diamond Core
36
22
Huffstetler
Diamond Core
14
14
All diamond drill holes were collared with HQ and were transitioned to NQ once non-weathered and unoxidized bedrock was encountered. Drill core was recovered from surface.
Oriented core was collected on select drill holes using the REFLEX ACT III tool by a qualified geologist at the drill rig. This data was highly beneficial in the interpretation of the pegmatite dikes.
The drill spacing is approximately 40 to 80 meters along strike and down dip. This spacing is sufficient to establish continuity in geology and grade for this pegmatite system.
Drill collars were located with the differential global positioning system (DGPS) with the Trimble Geo 7 unit which resulted in accuracies <1 meter. All coordinates were collected in State Plane and re-projected to Nad83 zone17 in which they are reported.
Down hole surveying was performed on each hole using a REFLEX EZ-Trac multi-shot instrument. Readings were taken approx. every 15 meters (50 feet) and recorded depth, azimuth, and inclination. All holes were geologically and geotechnically logged. All holes were photographed prior to sampling. Sampled zones were subsequently photographed a second time after the samples had been marked.
The core was cut in half with a diamond saw with one half submitted as the sample and the other half retained for reference. Standard sample intervals were a minimum of 0.35 m and a maximum of 1.5 m for HQ or NQ drill core, taking into account lithological boundaries (i.e. sample to, and not across, major contacts). A CRM or coarse blank was included at the rate of one for every 20 drill core samples (i.e. 5%). Sampling precision is monitored by selecting a sample interval likely to be mineralized and splitting the sample into two ¼ core duplicate samples over the same sample interval. These samples are consecutively numbered after the primary sample and recorded in the sample database as “field duplicates” and the primary sample number recorded. Field duplicates were collected at the rate of 1 in 20 samples when sampling mineralized drill core intervals.
Sample Analysis Method
Normative mineralogy was calculated from total fusion X-ray fluorescence (XRF) major element data using a least squares method (MINSQ – Herrmann, W. and Berry, R.F., 2002, Geochemistry: Exploration, Environment, Analysis, volume 2, pp. 361-368). The normative calculations were validated against and corrected where necessary using X-ray diffraction (XRD) Rietveld semi-quantitative mineralogical data from 38 sample pulps selected to represent a range of chemical compositions and mineralogy, as well as 3 QEMSCAN analyses of composite samples prepared for metallurgical test work.
Resource Estimation Methodology
Lithological and structural features were defined based upon geological knowledge of the deposit derived from drill core logs and geological observations on surface. Models of pegmatite dikes, weathering profiles and bulk densities generated for the previously released Mineral Resource Update Study announced on April 8, 2021 were used for this study.
Rotated block models were constructed in Micromine® that encompass all modelled dikes using parent cell sizes of 6 m (E) by 12 to 18 m (N) by 6 to 18m (Z). The drill hole files were flagged by the pegmatite and weathering domains they intersected. Statistical analysis of the domained data was undertaken in SuperVisor®. Samples were regularized to 1 meter composite lengths. Regularized weight percent mineral grades within the pegmatite model were analyzed to confirm the suitability of the Ordinary Kriging method also used for the previously released Global Mineral Resource estimate study announced on April 8, 2021. For each modelled pegmatite, regularized compositional grades for spodumene, quartz, albite, K-spar and muscovite were interpolated into the corresponding pegmatite block model along with grades for biotite and other gangue minerals. Albite and K-spar grade estimates are summed to generate a compositional grade estimate for feldspar by-product.
Block grade interpolation was validated by means of swath plots, comparison of sample and block model mineral grade averages and correlation coefficients, and by overlapping mineral grade distribution charts for sample and block model data. Cross sections of the block model with drill hole data superimposed were also reviewed.
Classification Criteria
Resource classification parameters are based on the validity and robustness of input data and the estimator’s judgment with respect to the proximity of resource blocks to sample locations and confidence with respect to the geological continuity of the pegmatite interpretations and grade estimates.
All blocks captured in pegmatite dike interpretation wireframes below the topography surface are classified as Inferred. Indicated classification boundaries define regions of blocks that, overall, meet the following criteria: Within major pegmatite dikes that are informed by at least two drill holes within a range of approximately 25 meters to the nearest drill hole in the along strike and down dip directions.
No Measured category resources are estimated.
Cut-Off Grade, Mining and Metallurgical Methods and Parameters
The economic extraction of by-product minerals is contingent on the economic extraction of lithium mineral resources at the Project. Accordingly, the by-product Mineral Resource Estimate is reported at a 0.4% Li2O cut-off grade, in line with lithium cut off grades utilized at comparable deposits.
Compositional grade and tonnage estimates for by-product mineral resources are presented in Table 3.
The depth, geometry, and grade of pegmatites at the property make them amenable to exploitation by open cut mining methods The Core resource model is constrained by a conceptual pit shell derived from a Whittle optimization using estimated block value and mining parameters appropriate for determining reasonable prospects of economic extraction. These include: maximum pit slope of 50° and strip ratio of 12, mining cost of US$2.25/t, spodumene concentration cost of US$25/t, a processing cost of US$2,616/t LiOH, a commodity price equivalent to US$12,910/t LiOH and with appropriate recovery and dilution factors. Material falling outside of this shell is considered to not meet reasonable prospects for eventual economic extraction.
Conceptual shells for Central and Huffstetler resource models, developed using the above parameters, extended to the base of the resource models and beyond the modeled strike extent of the resource model where the deposits are open. Accordingly, the entire Central and Huffstetler resource models are considered to have reasonable prospects of eventual economic extraction.
Reasonable prospects for metallurgical recovery of spodumene and by-product minerals are supported by the results of the variability and composite sample test work undertaken at SGS laboratories in Lakefield, Ontario and previously announced on May 13, 2020. Bulk samples of the quartz, feldspar and mica co-products from the Project have been evaluated for attributes such as product size distribution, chemical composition, purity, and color. Test work results demonstrate that by-products have specifications that are marketable to prospective regional customers and strategic partners in the solar glass, engineered quartz, ceramic tile, and other industrial minerals markets.
Future Exploration
Currently, Piedmont has five drill rigs conducting infill and exploration drilling at the Core Property. Piedmont may conduct additional drilling on the Huffstetler and Central properties in 2021. The results and the MRE’s reported in this press release will underpinthe Scoping Study update targeted for May 2021. A subsequent resource update is scheduled upon completion of the infill drilling, these will inform the Definitive Feasibility Study scheduled for September 2021.
About Piedmont Lithium
Piedmont Lithium (Nasdaq:PLL; ASX:PLL) is developing a world-class integrated lithium business in the United States, enabling the transition to a net zero world and the creation of a clean energy economy in America. Our location in the renowned Carolina Tin Spodumene Belt of North Carolina, the cradle of the lithium industry, positions us to be one of the world’s lowest cost producers of lithium hydroxide, and the most strategically located to serve the fast-growing US electric vehicle supply chain. The unique geographic proximity of our resources, production operations and prospective customers places us on the path to be among the most sustainable producers of lithium hydroxide in the world and should allow Piedmont to play a pivotal role in supporting America’s move to the electrification of transportation and energy storage. For more information, visit www.piedmontlithium.com.
Forward Looking Statements
This announcement may include forward-looking statements. These forward-looking statements are based on Piedmont’s expectations and beliefs concerning future events. Forward looking statements are necessarily subject to risks, uncertainties and other factors, many of which are outside the control of Piedmont, which could cause actual results to differ materially from such statements. Piedmont makes no undertaking to subsequently update or revise the forward-looking statements made in this announcement, to reflect the circumstances or events after the date of that announcement.
Cautionary Note to United States Investors Concerning Estimates of Measured, Indicated and Inferred Resources
The information contained herein has been prepared in accordance with the requirements of the securities laws in effect in Australia, which differ from the requirements of United States securities laws. The terms “mineral resource”, “measured mineral resource”, “indicated mineral resource” and “inferred mineral resource” are Australian mining terms defined in accordance with the 2012 Edition of the Australasian Code for Reporting of Exploration Results, Mineral Resources and Ore Reserves (the “JORC Code”). Comparable terms are now also defined by the U.S. Securities and Exchange Commission (“SEC”) in its newly adopted Modernization of Property Disclosures for Mining Registrants as promogulated in its S-K 1300 standards. While the guidelines for reporting mineral resources, including subcategories of measured, indicated, and inferred resources, are largely similar for JORC and S-K 1300 standards, documentation is ongoing with respect to the S-K 1300 Technical Report Summary template to formally categorize Piedmont’s mineral holdings as both JORC and S-K 1300 compatible. While the competent persons responsible for this announcement do not foresee any challenges in categorizing the resources delineated in this announcement as S-K 1300 compliant, information contained herein that describes Piedmont’s mineral deposits is not fully comparable to similar information made public by U.S. companies subject to reporting and disclosure requirements under the U.S. federal securities laws and the rules and regulations thereunder. U.S. investors are urged to consider Piedmont’s disclosure in its SEC filings, copies of which may be obtained from Piedmont or from the EDGAR system on the SEC’s website at http://www.sec.gov/.
Competent Persons Statement
The information in this announcement that relates to Exploration Results is based on, and fairly represents, information compiled or reviewed by Mr. Lamont Leatherman, a Competent Person who is a Registered Member of the ‘Society for Mining, Metallurgy and Exploration’, a ‘Recognized Professional Organization’ (RPO). Mr. Leatherman is an employee of the Company. Mr. Leatherman has sufficient experience that is relevant to the style of mineralization and type of deposit under consideration and to the activity being undertaken to qualify as a Competent Person as defined in the 2012 Edition of the ‘Australasian Code for Reporting of Exploration Results, Mineral Resources and Ore Reserves’. Mr. Leatherman consents to the inclusion in the report of the matters based on his information in the form and context in which it appears.
The information in this report that relates to Exploration Targets and Mineral Resources is based on, and fairly represents, information compiled or reviewed by Mr. Leon McGarry, a Competent Person who is a Professional Geoscientist (P.Geo.) and registered member of ‘Professional Geoscientists Ontario’ (PGO no. 2348), a ‘Recognized Professional Organization’ (RPO). Mr. McGarry is a Principal Resource Geologist and full-time employee at McGarry Geoconsulting Corp. Mr. McGarry has sufficient experience which is relevant to the style of mineralization and type of deposit under consideration and to the activity which he is undertaking to qualify as a Competent Person as defined in the 2012 Edition of the ‘Australasian Code for Reporting of Mineral Resources and Ore Reserves’. Mr. McGarry consents to the inclusion in this report of the results of the matters based on his information in the form and context in which it appears.
This announcement has been authorized for release by the Company’s CEO, Mr. Keith Phillips
Appendix 1: JORC Table 1 Checklist of Assessment and Reporting Criteria
Section 1 Sampling Techniques and Data
Criteria
JORC Code explanation
Commentary
Sampling techniques
Nature and quality of sampling (e.g. cut channels, random chips, or specific specialised industry standard measurement tools appropriate to the minerals under investigation, such as downhole gamma sondes, or handheld XRF instruments, etc.). These examples should not be taken as limiting the broad meaning of sampling.
Include reference to measures taken to ensure sample representivity and the appropriate calibration of any measurement tools or systems used.
Aspects of the determination of mineralisation that are Material to the Public Report. In cases where ‘industry standard’ work has been done this would be relatively simple (e.g. ‘reverse circulation drilling was used to obtain 1 m samples from which 3 kg was pulverised to produce a 30 g charge for fire assay’). In other cases more explanation may be required, such as where there is coarse gold that has inherent sampling problems. Unusual commodities or mineralisation types (e.g. submarine nodules) may warrant disclosure of detailed information.
All drill results reported are from diamond core samples or rotary sonic drill core. The core was split at an orientation not influenced by the distribution of mineralization within the drill core (i.e. bisecting mineralized veins or cut perpendicular to a fabric in the rock that is independent of mineralization, such as foliation). Diamond and Rotary Sonic drilling provided continuous core which allowed continuous sampling of mineralized zones. The core sample intervals were a minimum of 0.35m and a maximum of 1.5m for HQ or NQ drill core (except in saprolitic areas of poor recovery where sample intervals may exceed 1.5m in length). Sampling took into account lithological boundaries (i.e. sample was to, and not across, major contacts).
Standards and blanks were inserted into the sample stream to assess the accuracy, precision and methodology of the external laboratories used. In addition, field duplicate samples were inserted to assess the variability of the mineralization., The laboratories undertake their own duplicate sampling as part of their internal QA/QC processes. Examination of the QA/QC sample data indicates satisfactory performance of field sampling protocols and assay laboratories providing acceptable levels of precision and accuracy.
Drilling techniques
Drill type (e.g. core, reverse circulation, open-hole hammer, rotary air blast, auger, Bangka, sonic, etc.) and details (e.g. core diameter, triple or standard tube, depth of diamond tails, face-sampling bit or other type, whether core is oriented and if so, by what method, etc.).
All diamond drill holes were collared with HQ and were transitioned to NQ once non-weathered and unoxidized bedrock was encountered. Drill core was recovered from surface.
Rotary Sonic core was only drilled in the saprolitic zones. Drill core was recovered from surface. Holes were terminated in the saprolitic zone or once unoxidized rock was encountered
Oriented core was collected on selected drill holes using the REFLEX ACT III tool by a qualified geologist at the drill rig. The orientation data is currently being evaluated.
Drill sample recovery
Method of recording and assessing core and chip sample recoveries and results assessed.
Measures taken to maximise sample recovery and ensure representative nature of the samples.
Whether a relationship exists between sample recovery and grade and whether sample bias may have occurred due to preferential loss/gain of fine/coarse material.
The diamond core was transported from the drill site to the logging facility in covered boxes with the utmost care. Once at the logging facility, the following procedures were carried out on the core:
Re-aligning the broken core in its original position as closely as possible.
The length of recovered core was measured, and meter marks clearly placed on the core to indicate depth to the nearest centimeter.
The length of core recovered was used to determine the core recovery, which is the length of core recovered divided by the interval drilled (as indicated by the footage marks which was converted to meter marks), expressed as a percentage. This data was recorded in the database. The core was photographed wet before logged.
The core was photographed again immediately before sampling with the sample numbers visible.
For the Sonic core, recovery, geologic logging and sampling was conducted at the drill site by a Piedmont geologist.
Sample recovery was consistently good except for zones within the oxidized clay and saprolite zones. These zones were generally within the top 20m of the hole. No relationship is recognized between recovery and grade. The diamond drill holes were designed to intersect the targeted pegmatite below the oxidized zone where the sonic drilling was targeting pegmatites in the saprolitic zone.
Logging
Whether core and chip samples have been geologically and geotechnically logged to a level of detail to support appropriate Mineral Resource estimation, mining studies and metallurgical studies.
Whether logging is qualitative or quantitative in nature. Core (or costean, channel, etc.) photography.
The total length and percentage of the relevant intersections logged.
Geologically, data was collected in detail, sufficient to aid in Mineral Resource estimation.
Core logging consisted of marking the core, describing lithologies, geologic features, percentage of spodumene and structural features measured to core axis.
The core was photographed wet before logging and again immediately before sampling with the sample numbers visible.
All the core from the form the 107 holes reported was logged.
Sub-sampling techniques and sample preparation
If core, whether cut or sawn and whether quarter, half or all core taken.
If non-core, whether riffled, tube sampled, rotary split, etc. and whether sampled wet or dry.
For all sample types, the nature, quality and appropriateness of the sample preparation technique.
Quality control procedures adopted for all sub-sampling stages to maximise representivity of samples.
Measures taken to ensure that the sampling is representative of the in situ material collected, including for instance results for field duplicate/second-half sampling.
Whether sample sizes are appropriate to the grain size of the material being sampled.
Diamond core was cut in half with a diamond saw. Sonic Core was split with a large knife or machete.
Standard sample intervals were a minimum of 0.35m and a maximum of 1.5m for HQ or NQ drill core, taking into account lithological boundaries (i.e. sample to, and not across, major contacts).
Prior to 2020, the preparation code is CRU21 (crush to 75% of sample <2mm) and PUL45 (pulverize 250g to 85% <75 microns), in 2020 the code was changed to CRU16.
A CRM or coarse blank was included at the rate of one for every 20 drill core samples (i.e. 5%).
Sampling precision is monitored by selecting a sample interval likely to be mineralized and splitting the sample into two ¼ core duplicate samples over the same sample interval. These samples are consecutively numbered after the primary sample and recorded in the sample database as “field duplicates” and the primary sample number recorded. Field duplicates were collected at the rate of 1 in 20 samples when sampling mineralized drill core intervals
Samples were numbered sequentially with no duplicates and no missing numbers. Triple tag books using 9-digit numbers were used, with one tag inserted into the sample bag and one tag stapled or otherwise affixed into the core tray at the interval the sample was collected. Samples were placed inside pre-numbered sample bags with numbers coinciding to the sample tag. Quality control (QC) samples, consisting of certified reference materials (CRMs), were given sample numbers within the sample stream so that they are masked from the laboratory after sample preparation and to avoid any duplication of sample numbers.
Quality of assay data and laboratory tests
The nature, quality and appropriateness of the assaying and laboratory procedures used and whether the technique is considered partial or total.
For geophysical tools, spectrometers, handheld XRF instruments, etc., the parameters used in determining the analysis including instrument make and model, reading times, calibrations factors applied and their derivation, etc.
Nature of quality control procedures adopted (e.g. standards, blanks, duplicates, external laboratory checks) and whether acceptable levels of accuracy (i.e. lack of bias) and precision have been established.
All samples were shipped to the SGS laboratory in Lakefield, Ontario or Garson, Ontario
Prior to 2020, the preparation code is CRU21 (crush to 75% of sample <2mm) and PUL45 (pulverize 250g to 85% <75 microns), in 2020 the code was changed to CRU16 and PUL10, respectively.
Prior to 2020, the analysis code for lithium was GE ICP91A, which uses a peroxide fusion with an ICP finish, and has lower and upper detection limits of 0.001 and 50,000 (5%) ppm respectively. In 2020, the code was changed to GE ICP92A50. Accuracy monitoring was achieved through submission and monitoring of certified reference materials (CRMs).
XRF analysis code for major oxides prior to 2020 was GO XRF76V. In 2020 the code was changed to GO_XRF72
Sample numbering and the inclusion of CRMs was the responsibility of the project geologist submitting the samples. A CRM or coarse blank was included at the rate of one for every 20 drill core samples (i.e. 5%).
The CRMs used for this program were supplied by Geostats Pty Ltd of Perth, Western Australia. Details of the CRMs are provided below. A sequence of these CRMs covering a range in Li values and, including blanks, were submitted to the laboratory along with all dispatched samples so as to ensure each run of 100 samples contains the full range of control materials. The CRMs were submitted as “blind” control samples not identifiable by the laboratory.
Details of CRMs used in the drill program (all values ppm):
CRM
Manufacturer
Lithium
1 Std Dev
GTA-02
Geostats
1814
50
GTA-04
Geostats
9550
246
GTA-08
Geostats
1102
50
GTA-09
Geostats
4837
174
Sampling precision was monitored by selecting a sample interval likely to be mineralized and splitting the sample into two ¼ core duplicate samples over the same sample interval. These samples were consecutively numbered after the primary sample and recorded in the sample database as “field duplicates” and the primary sample number recorded. Field duplicates were collected at the rate of 1 in 20 samples when sampling mineralized drill core intervals. Random sampling precision was monitored by splitting samples at the sample crushing stage (coarse crush duplicate) and at the final sub-sampling stage for analysis (pulp duplicates). The coarse, jaw-crushed, reject material was split into two preparation duplicates, sometimes referred to as second cuts, crusher or preparation duplicates, which were then pulverized and analyzed separately. These duplicate samples were selected randomly by the laboratory. Analytical precision was also monitored using pulp duplicates, sometimes referred to as replicates or repeats. Data from all three types of duplicate analyses was used to constrain sampling variance at different stages of the sampling and preparation process.
Examination of the QA/QC sample data indicates satisfactory performance of field sampling protocols and assay laboratories providing acceptable levels of precision and accuracy.
Verification of sampling and assaying
The verification of significant intersections by either independent or alternative company personnel.
The use of twinned holes.
Documentation of primary data, data entry procedures, data verification, data storage (physical and electronic) protocols.
Discuss any adjustment to assay data.
Multiple representatives of Piedmont Lithium Inc. have inspected and verified the results.
CSA has conducted multiple site visits. Dennis Arne (Managing Director -Principal Consultant) toured the site, facilities and reviewed core logging and sampling workflow as well as Leon McGarry (Senior Resource Geologist). Each provided comments on how to improve our methods and have been addressed. Verification core samples were collected by Leon McGarry.
No holes were twinned.
Three-meter rods or 10 foot core barrels were used. Li% was converted to Li2O by multiplying Li% by 2.153.
For by-products, accuracy of the normative mineralogy was monitored using Rietveld semi-quantitative mineralogy for 38 XRD analyses from pulp samples as well as 3 QEMSCAN analyses of composites used for metallurgical test work. Normative estimates for quartz, spodumene, albite and K-feldspar (microcline) have average relative accuracies less than +/- 2 % compared to the QEMSCAN composite data, with muscovite showing a positive relative bias of 11.6 % (i.e. 11.6 % more muscovite in the QEMSCAN results than the normative mineralogy predicts). The normative mineralogical estimates for quartz, spodumene, albite, K-feldspar and muscovite have average relative biases of 1 %, -3.7 %, 11.9 %, 2.9 % and 6.3 %, respectively, compared to the XRD results, excluding XRD mineral estimates of 2 % or less taken to be at or close to the method limit of detection, and following correction of the normative estimates for K-feldspar and muscovite using the XRD data. The QEMSCAN mineralogical data are taken to be more reliable than the XRD data given complications associated with the Rietveld analysis of minerals with a strong preferred orientation, such as muscovite.
Location of data points
Accuracy and quality of surveys used to locate drill holes (collar and down-hole surveys), trenches, mine workings and other locations used in Mineral Resource estimation.
Specification of the grid system used.
Quality and adequacy of topographic control.
Drill collars were located with the Trimble Geo 7 which resulted in accuracies <1m.
All drill hole collar coordinates were collected in State Plane and re-projected to Nad83 zone17 in which they are reported.
Drill hole surveying was performed on each hole using a REFLEX EZ-Trac multi-shot instrument. Readings were taken approx. every 15 meters and recorded depth, azimuth, and inclination. In 2020, Piedmont conducted a LIDAR survey for the Project area
Data spacing and distribution
Data spacing for reporting of Exploration Results.
Whether the data spacing and distribution is sufficient to establish the degree of geological and grade continuity appropriate for the Mineral Resource and Ore Reserve estimation procedure(s) and classifications applied.
Whether sample compositing has been applied.
For selected areas, the drill spacing is approximately 40 to 80 m along strike and down dip. This spacing is sufficient to establish continuity in geology and grade for this pegmatite system.
Composite samples are reported in Li2O%, this is calculated by multiplying drill length by Li2O for each sample; then the weighted averages for multiple samples are totaled and divided by the total drill length for the selected samples
Orientation of data in relation to geological structure
Whether the orientation of sampling achieves unbiased sampling of possible structures and the extent to which this is known, considering the deposit type.
If the relationship between the drilling orientation and the orientation of key mineralised structures is considered to have introduced a sampling bias, this should be assessed and reported if material.
The drill holes were designed and oriented with inclinations ranging from -52.4 to -85.8 degrees, to best intersect the pegmatite bodies as close to perpendicularly as possible.
Assay results in Appendix 1 are drill lengths and not true thicknesses.
All results reported for rock chip samples are from surface outcrop, sub-crop and float blocks. The reported samples are considered as grab samples and do not represent a continuous sample over any width or length of the mineralized system.
Sample security
The measures taken to ensure sample security.
Drill core samples and rock chip samples were shipped directly from the core shack by the project geologist in sealed rice bags or similar containers using a reputable transport company with shipment tracking capability so that a chain of custody can be maintained. Each bag was sealed with a security strap with a unique security number. The containers were locked in a shed if they were stored overnight at any point during transit, including at the drill site prior to shipping. The laboratory confirmed the integrity of the rice bag seals upon receipt
Audits or reviews
The results of any audits or reviews of sampling techniques and data.
CSA Global developed a “Standard Operating Procedures” manual in preparation for the drilling program.
CSA has conducted multiple site visits. Dennis Arne (Managing Director -Principal Consultant) toured the site and facilities as well as Leon McGarry (Senior Resource Geologist). Each provided comments on how to improve our methods and have been addressed. Verification core samples were collected by Leon McGarry.
Section 2 Reporting of Exploration Results
Criteria
JORC Code explanation
Commentary
Mineral tenement and land tenure status
Type, reference name/number, location and ownership including agreements or material issues with third parties such as joint ventures, partnerships, overriding royalties, native title interests, historical sites, wilderness or national park and environmental settings.
The security of the tenure held at the time of reporting along with any known impediments to obtaining a licence to operate in the area.
As of March 31, 2021, the Project comprised approximately 2,667 acres of surface property and associated mineral rights in North Carolina, of which approximately 988 acres are owned, approximately 113 acres are subject to long-term lease, approximately 79 acres are subject to lease-to-own agreements, and approximately 1,487 acres are subject to exclusive option agreements. These exclusive option agreements, upon exercise, allow us to purchase or, in some cases, enter into long-term leases for the surface property and associated mineral rights.
There are no known historical sites, wilderness or national parks located within the Project area and there are no known impediments to obtaining a licence to operate in this area.
Exploration done by other parties
Acknowledgment and appraisal of exploration by other parties.
The Project is focused over an area that has been explored for lithium dating back to the 1950’s where it was originally explored by Lithium Corporation of America which was subsequently acquired by FMC Corporation. Most recently, North Arrow explored the Project in 2009 and 2010. North Arrow conducted surface sampling, field mapping, a ground magnetic survey and two diamond drilling programs for a total of 19 holes. Piedmont Lithium Inc. has obtained North Arrow’s exploration data.
Geology
Deposit type, geological setting and style of mineralisation.
Spodumene pegmatites, located near the litho tectonic boundary between the Inner Piedmont and Kings Mountain belt. The mineralization is thought to be concurrent and cross-cutting dike swarms extending from the Cherryville granite, as the dikes progressed further from their sources, they became increasingly enriched in incompatible elements such as Li, tin (Sn). The dikes are considered to be unzoned.
Drill hole Information
A summary of all information material to the understanding of the exploration results including a tabulation of the following information for all Material drill holes:
easting and northing of the drill hole collar
elevation or RL (Reduced Level – elevation above sea level in metres) of the drill hole collar
dip and azimuth of the hole
down hole length and interception depth
hole length.
If the exclusion of this information is justified on the basis that the information is not Material and this exclusion does not detract from the understanding of the report, the Competent Person should clearly explain why this is the case.
Details of all reported in previous press releases
Data aggregation methods
In reporting Exploration Results, weighting averaging techniques, maximum and/or minimum grade truncations (e.g. cutting of high grades) and cut-off grades are usually Material and should be stated.
Where aggregate intercepts incorporate short lengths of high grade results and longer lengths of low grade results, the procedure used for such aggregation should be stated and some typical examples of such aggregations should be shown in detail.
The assumptions used for any reporting of metal equivalent values should be clearly stated.
All drill hole intercepts reported are for down hole thickness not true thickness.
Weighted averaging was used in preparing the intercepts reported.
The drill intercepts were calculated by adding the weighted value (drill length x assay) for each sample across the entire pegmatite divided by the total drill thickness of the pegmatite. For each mineralized pegmatite, all assays were used in the composite calculations with no upper or lower cut-offs. Mineralized pegmatite is defined as spodumene bearing pegmatite.
Intercepts were reported for entire pegmatites, taking into account lithological boundaries (i.e. sample to, and not across, major contacts), with additional high-grade sub intervals reported from the same pegmatite. In the case where thin wall rock intervals were included, a value of 0% Li2O was inserted for the assay value, thus giving that individual sample a weighted value of 0% Li2O.
Cumulative thicknesses are reported for select drill holes. These cumulative thicknesses do not represent continuous mineralized intercepts. The cumulative thickness for a drill hole is calculated by adding the drill widths of two or more mineralized pegmatites encountered in the drill hole, all other intervals are omitted from the calculation.
Li% was converted to Li2O% by multiplying Li% by 2.153.
Relationship between mineralisation widths and intercept lengths
These relationships are particularly important in the reporting of Exploration Results.
If the geometry of the mineralisation with respect to the drill hole angle is known, its nature should be reported.
If it is not known and only the down hole lengths are reported, there should be a clear statement to this effect (e.g. ‘down hole length, true width not known’).
Drill intercepts are reported as Li2O% over the drill length, not true thickness. The pegmatites targeted strike northeast-southwest and dip moderately to the southeast or have a near vertical orientation. The holes were drilled to the northwest and southeast with inclinations ranging between -52.4 and -85.8.
Diagrams
Appropriate maps and sections (with scales) and tabulations of intercepts should be included for any significant discovery being reported These should include, but not be limited to a plan view of drill hole collar locations and appropriate sectional views.
Appropriate diagrams are in previous press releases.
Balanced reporting
Where comprehensive reporting of all Exploration Results is not practicable, representative reporting of both low and high grades and/or widths should be practiced to avoid misleading reporting of Exploration Results.
All of the relevant exploration data for the Exploration Results available at this time has been provided in this report.
Other substantive exploration data
Other exploration data, if meaningful and material, should be reported including (but not limited to): geological observations; geophysical survey results; geochemical survey results; bulk samples – size and method of treatment; metallurgical test results; bulk density, groundwater, geotechnical and rock characteristics; potential deleterious or contaminating substances.
Soil sampling and walking magnetometer geophysical surveys have been completed on the Core and Central property as well as other regional properties
Further work
The nature and scale of planned further work (e.g. tests for lateral extensions or depth extensions or large-scale step-out drilling).
Diagrams clearly highlighting the areas of possible extensions, including the main geological interpretations and future drilling areas, provided this information is not commercially sensitive.
Piedmont may conduct additional drilling in 2021 at Central Property. Infill drilling is underway at the Core Property with results informing a DFS to be reported later in 2021.
Section 3 Estimation and Reporting of Mineral Resources
Criteria
JORC Code explanation
Commentary
Database integrity
Measures taken to ensure that data has not been corrupted by, for example, transcription or keying errors, between its initial collection and its use for Mineral Resource estimation purposes.
Geological and geotechnical observations are recorded digitally using the Geospark® Database System directly into a central relational database using standardized logging codes developed for the Project. To minimize risk of transcription errors sample data and analytical results are imported directly into the central database from the independent laboratory.
Data validation procedures used.
An extract of the Core database was validated by the Competent Person for internal integrity via Micromine ® validation functions. This includes logical integrity checks of drill hole deviation rates, presence of data beyond the hole depth maximum, and overlapping from-to errors within interval data. Visual validation checks were also made for obviously spurious collar co-ordinates or downhole survey values.
Site visits
Comment on any site visits undertaken by the Competent Person and the outcome of those visits.
The Competent Person; Leon McGarry P.Geo, has undertaken multiple personal inspections of the Piedmont Properties during 2017, 2018 and 2019 to review exploration sites, drill core and work practices. The site geology, sample collection, and logging data collection procedures were examined. A semi-random selection of drill collar locations at the Core, Central and Sunnyside properties was verified by the collection of independent check samples from drill core and outcrop from the Core Property. In addition to spodumene, the presence of by-product minerals: quartz, feldspar (albite and K-spar) and muscovite mineralization were verified by the inspection of drill core and outcrop.
Travel to the site was curtailed during 2020 and 2021 due to the impact of the COVID-19 pandemic. The Competent Person monitored exploration at the property completed during this period through remote review of core photography and exploration activities by regular video conferencing with the exploration team.
The outcome of site visits and subsequent remote review was the determination that data has been collected in a manner that supports reporting a Mineral Resource Estimate (MRE) for the Core, Central and Huffstetler properties in accordance with the JORC Code, and controls to the mineralization are well-understood.
If no site visits have been undertaken indicate why this is the case.
Site visits have been conducted.
Geological interpretation
Confidence in (or conversely, the uncertainty of) the geological interpretation of the mineral deposit.
Geological models developed for the Core, Central and Huffstetler deposits are based on the lithological logging of visually distinct pegmatite spodumene-bearing pegmatites within amphibolite-biotite schist and metasedimentary host facies. Deposit geology is well understood based on surface pegmatite outcrops and extensive drilling at spacings sufficient to provide multiple points of observation for modeled geological features. Thicker units show good continuity between points of observation and allow a higher level of confidence for volume and mineralization interpretations. Whereas, the grade and thickness of thinner or weathered or altered units tend to be more discontinuous and interpretations have more uncertainty.
Nature of the data used and of any assumptions made.
Input data used for geological modeling are derived from qualitative interpretation of observed lithology and alteration features; semi-quantitative interpretation of mineral composition and the orientation of structural features; and quantitative determinations of the geochemical composition of samples returned from core drilling.
The effect, if any, of alternative interpretations on Mineral Resource estimation.
Geological models developed for the Core, Central and Huffstetler deposits are underpinned by a good understanding of the deposit geology at the Piedmont properties. Based on input drillhole data, including orientated core measurements, and surface mapping, pegmatite dikes were modeled as variably orientated vertical to sub-horizontal sheets. Where drill data is sparse (i.e. at 80 m spacings) alternative interpretations, of the continuity of individual pegmatites between holes could be made. Alternate interpretations would adjust tonnage estimates locally but would not likely yield a more geologically reasonable result, or impact tonnage and grade estimates beyond an amount congruent with assigned confidence classifications.
The use of geology in guiding and controlling Mineral Resource estimation.
The model developed for mineralization is guided by observed geological features and is principally controlled by the interpreted presence or absence of spodumene-bearing pegmatite. Estimated deposit densities are controlled by interpreted weathering surfaces. Above the saprolite surface, and in outcrop, spodumene-bearing pegmatites have variable Li2O and mineral composition grade populations, sufficiently similar to fresh rock, allowing Li2O and mineral composition grade estimates not to be controlled by interpreted weathering surfaces.
The factors affecting continuity both of grade and geology.
Geological continuity is controlled by the preference for fractionated pegmatitic fluids to follow preferential structural pathways within the amphibolite and metasediment host rocks. Grade continuity within the pegmatite is controlled by pegmatite thickness, degree of fluid fractionation and the intensity of spodumene alteration to muscovite and amount of weathering. At the Core Property, modeled continuity is impacted by post-mineralization diabase intrusions and fault offsets in areas of limited extent. Modeled pegmatite extent is limited to within the Core, Central and Huffstetler property permit boundaries.
Dimensions
The extent and variability of the Mineral Resource expressed as length (along strike or otherwise), plan width, and depth below surface to the upper and lower limits of the Mineral Resource.
Spodumene-bearing pegmatites on the Core Property are assigned to three major corridors. Corridors extend over a strike length of up to 1.7 km and commonly have a set of thicker dikes of 10–20 m true thickness at their core. These major dikes strike northeast and dip steep to moderately toward the southeast. Dikes are intersected by drilling to a depth of 300 m down dip. Dikes are curvi-planar in aspect. Flat to shallowly dipping sills and inclined sheets are encountered across the Core Property and are tested by drilling over 600 m along strike and 520 m down dip. The vertical thickness of individual sills and inclined sheets range from 1 m to 10 m. A close spaced series of sills and inclined sheets may have cumulative thicknesses greater than 10 m. Spodumene-bearing pegmatites, or a close spaced series of pegmatites, can be traced between drillhole intercepts and surface outcrops for over 1,400 m. Although individual units may pinch out, the deposit is open at depth. The Mineral Resource has a maximum vertical depth of 210 m, beginning at the topography surface. Ninety-five percent of the Mineral Resource is within 150 m of the topography surface.
Spodumene-bearing pegmatites on the Central Property fall within a corridor that extends over a strike length of up to 0.6 km and contains a pair of thicker dikes of 10 m to 20 m true thickness at their core. These major dikes strike northeast and dip steeply to the southeast. Dikes are intersected by drilling to a depth of 225 m down dip. Although individual units may pinch out, the deposit is open at depth. The Central Mineral Resource has a maximum vertical depth of 275 m, beginning at the topography surface. On average, the model extends to 200 m below surface.
Spodumene bearing pegmatites on the Huffstetler Property fall within a corridor that extends over a strike length of up to 0.4 km and form a stacked series of inclined sheets each 2 m to 18 m true thickness. Inclined sheets strike northeast and dip moderately to the northwest. Spodumene bearing pegmatites are intersected by drilling to a depth of 200 m down dip from surface however up-dip extents are limited by the south eastern edge of the permit boundary. Although individual units may pinch out, the deposit is open at depth. The Huffstetler Mineral Resource has a maximum vertical depth of 150 m, beginning at the topography surface.
Predominantly, entire intervals of spodumene-bearing pegmatite are selected for modeling. Occasionally interstitial waste material 1 m to 2 m in thickness may be included to facilitate modeling at a resolution appropriate for available data spacings. No minimum thickness criteria are used for modeling; however, a pegmatite must be present in at least two drillholes to ensure adequate control on model geometry. Generally, spodumene-bearing pegmatite models are sufficient for use as MRE domains.
Estimation and modelling techniques
The nature and appropriateness of the estimation technique(s) applied and key assumptions, including treatment of extreme grade values, domaining, interpolation parameters and maximum distance of extrapolation from data points. If a computer assisted estimation method was chosen include a description of computer software and parameters used.
Samples coded by the modeled pegmatite domain they exploit were composited to 1 m intervals, a length equal to the dominant drill sample interval, and were then evaluated for the presence of extreme grades. Domained samples underwent spatial analysis within the Supervisor™ software which was used to define semi-variogram models for the Li2O grades and develop search ellipsoids and parameters. A four-pass search strategy was employed, with successive searches using more relaxed parameters for selection of input composite data and/or a larger search radius. Core, Central and Huffstetler Mineral Resources were estimated using Ordinary Kriging (OK) into block models created in Micromine®. The Li2O variable was estimated independently in a univariate sense.
In addition to Li2O, regularized weight percent grades are modeled for nine minerals: spodumene, quartz, albite, K-spar, muscovite, anorthite, apatite, biotite and diopside, which were estimated independently in a univariate sense. The spatial variability of mineral grades is sufficiently similar to Li2O grades to allow the use of the same search parameters utilized for the previously released Mineral Resource study announced on April 8, 2021. The consistent estimation approach was selected to ensure block compositional grade proportions honor those of input samples, and that block grade estimates for compositional minerals approximate 100%.
The availability of check estimates, previous estimates and/or mine production records and whether the Mineral Resource estimate takes appropriate account of such data.
This Core Property by-product MRE is an update to the by-product MRE for the Core Property reported on August 1, 2019.
Estimates of by-product grades and tonnages show good agreement with previous estimates. Tonnages show an incremental increase attributable to drilling completed since the pervious estimates.
This Central Property by-product MRE is a maiden resource. This Huffstetler Property by-product MRE is a maiden resource.
For each property resource estimate interpolations were checked visually, statistically, and using an Inverse Distance Weighted estimate.
The assumptions made regarding recovery of by-products.
Bench-scale metallurgical test work undertaken on material from the Core Property at NCSU-MRL announced on September 4, 2018 and at SGS Lakefield announced on May 13, 2020, recovered quartz, feldspar and mica concentrates as by-products to spodumene. These products were recovered at sufficient amounts and qualities to support the estimation of by-product Mineral Resources for the Core Property in addition to spodumene-hosted Li2O.
Pegmatites at the Central and Huffstetler properties have comparable physical properties to Core Property pegmatites and have similar mineralogical proportions. Central and Huffstetler pegmatites are therefore concluded to have comparable grades and by-product specifications.
Estimation of deleterious elements or other non-grade variables of economic significance (e.g. sulphur for acid mine drainage characterisation).
Within the resource model, deleterious elements, such as iron are reported to be at acceptably to low levels. Metallurgical test work demonstrates that deleterious elements will not impede the economic extraction of the modeled spodumene hosted lithium and by-product minerals. No estimates for other elements were generated.
Core Property pegmatites have comparable mineralogical and physical properties to pegmatites at the Central and Huffstetler properties.
In the case of block model interpolation, the block size in relation to the average sample spacing and the search employed.
Rotated block models aligned to the dominant strike of pegmatites were orientated at 35° for the Core and Huffstetler deposits and at 40° for the Central deposit.
Given the variable orientation and the thickness of the Core and Huffstetler MRE domains, a block size of 6 m(E) x 12 m(N) x 6 m(RL) was selected to honor moderately dipping pegmatites in the across strike dimension, and the shallow dipping pegmatites in the vertical dimension. For the Central Property, a block size of 6 m(E) x 18 m(N) x 18m(RL) was selected to honor steeply dipping pegmatites in the across strike dimension.
Core, Central and Huffstetler parent block dimensions compare to an average drillhole spacing of 40 m within the more densely informed areas, that increases up to an 80 m spacing in less well-informed areas. Blocks were sub-celled to a minimum resolution of 2 m(E) x 4 m(N) x 1 m(RL).
Any assumptions behind modelling of selective mining units.
Block dimensions are assumed to be appropriate for the mining selectivity achievable via open-pit mining method and likely bench heights. At the neighboring Hallman-Beam mine operating benches of 9 m were mined.
Any assumptions about correlation between variables.
For the Core, Central and Huffstetler properties modeled by-product mineral grades show both positive and negative correlations between modeled variables. Regularized weight percent grades are modeled independently in a univariate sense using search parameters that result in block model grade estimates that honor mineral proportions that result from normative calculations.
Description of how the geological interpretation was used to control the resource estimates.
Modeled pegmatite dikes host and constrain the mineralization model. Each pegmatite domain was estimated independently with hard boundaries assumed for each separate pegmatite body. The dominant modeled orientation of pegmatite units was used to inform search ellipse parameters, so that in-situ grade trends are reflected in the block model.
Discussion of basis for using or not using grade cutting or capping.
Domained by-product mineral grade data show normal distributions that do not contain extreme values and have coefficients of variation less than 1. On this basis, it is not necessary to cap by-product mineral grades.
The process of validation, the checking process used, the comparison of model data to drill hole data, and use of reconciliation data if available.
Block model estimates were validated visually and statistically. Estimated block grades were compared visually in section against the corresponding input data values. Additionally, trend plots of input data and block estimates were compared for swaths generated in each of the three principal geometric orientations (northing, easting, and elevation). Statistical validation included a comparison of composite means, and average block model grades, and a validation by Global Change of Support analysis.
Moisture
Whether the tonnages are estimated on a dry basis or with natural moisture, and the method of determination of the moisture content.
Tonnages are reported on a dry basis.
Cut-off parameters
The basis of the adopted cut-off grade(s) or quality parameters applied.
The economic extraction of by-product minerals at the is contingent on the economic extraction of lithium Mineral Resources at the Project. Accordingly, the by-product Mineral Resource is reported using a 0.4% Li2O cut-off which approximates cut-off grades used for comparable spodumene-bearing pegmatite deposits exploited by open pit mining.
Mining factors or assumptions
Assumptions made regarding possible mining methods, minimum mining dimensions and internal (or, if applicable, external) mining dilution. It is always necessary as part of the process of determining reasonable prospects for eventual economic extraction to consider potential mining methods, but the assumptions made regarding mining methods and parameters when estimating Mineral Resources may not always be rigorous. Where this is the case, this should be reported with an explanation of the basis of the mining assumptions made.
The methods used to design and populate the Core and Central Mineral Resource block models were defined under the assumption that the deposit will be mined via open pit methods, since the depth, geometry and grade of pegmatites at the property make them amenable to exploitation by those methods. Inspection of drill cores and the proximity of open pit mines in similar rock formations indicate that ground conditions are likely suitable for such a mining method.
The Core resource model is constrained by a conceptual pit shell derived from a Whittle optimization using estimated block value and mining parameters appropriate for determining reasonable prospects of economic extraction. These include a maximum pit slope of 50°, appropriate recovery and dilution factors, a mining cost of US$2.25/t, a SC6 concentration cost of US$25 /t, a processing cost of US$2,616/t LiOH and a commodity price equivalent to US$ 12,910 /t LiOH.
Conceptual shells for Central and Huffstetler resource models, developed using the above parameters, extended to the base of the resource model where the deposit is open, and beyond the modeled strike extent of the resource model where the deposit is open. Accordingly, the entire Central and Huffstetler resource models are considered to have reasonable prospects of eventual economic extraction.
Metallurgical factors or assumptions
The basis for assumptions or predictions regarding metallurgical amenability. It is always necessary as part of the process of determining reasonable prospects for eventual economic extraction to consider potential metallurgical methods, but the assumptions regarding metallurgical treatment processes and parameters made when reporting Mineral Resources may not always be rigorous. Where this is the case, this should be reported with an explanation of the basis of the metallurgical assumptions made.
The materials targeted for extraction comprise spodumene, quartz, feldspar and mica minerals for which metallurgical processing methods are well established. Based on metallurgical test work completed by SGS and reported by the company, which indicates:
Spodumene concentrate grades exceeding 6.0% Li2O and less than 1.0% Fe2O3.
Quartz samples delivered to potential solar glass customers and met customer quality expectations and has characteristics comparable to marketable quartz products.
Feldspar concentrate, comprised of albite and K-spar minerals, has characteristics comparable to marketable feldspar products.
Muscovite mica concentrate has physical properties comparable to marketable muscovite products.
The Competent Person has assumed that metallurgical concerns will not pose any significant impediment to the economic processing and extraction of spodumene from mined pegmatite.
Environmental factors or assumptions
Assumptions made regarding possible waste and process residue disposal options. It is always necessary as part of the process of determining reasonable prospects for eventual economic extraction to consider the potential environmental impacts of the mining and processing operation. While at this stage the determination of potential environmental impacts, particularly for a greenfields project, may not always be well advanced, the status of early consideration of these potential environmental impacts should be reported. Where these aspects have not been considered this should be reported with an explanation of the environmental assumptions made.
No assumptions have been made regarding waste streams and disposal options; however, the development of local pegmatite deposits within similar rock formations was not impeded by negative environmental impacts associated with their exploitation by open cut mining methods. It is reasonable to assume that in the vicinity of the Project area, there is sufficient space available for the storage of waste products arising from mining.
Bulk density
Whether assumed or determined. If assumed, the basis for the assumptions. If determined, the method used, whether wet or dry, the frequency of the measurements, the nature, size and representativeness of the samples.
In situ dry bulk densities for the Core, Central and Huffstetler Mineral Resource were assigned on a lithological basis using representative averages.
At Core average bulk densities for spodumene bearing pegmatite and waste rock were derived from 1,568 determinations on selected drill core from the Property made by Piedmont geologists in the field and 139 by SGS Labs, Lakefield, Ontario.
At Central average bulk densities for spodumene bearing pegmatite and waste rock were derived from 197 determinations made by Piedmont geologists in the field on selected drill core from the Property. Density of weathered spodumene bearing pegmatite is taken from available data at Core property as of January 8, 2021.
At Huffstetler average bulk densities for fresh spodumene bearing pegmatite and waste rock were derived from 55 determinations made by Piedmont geologists in the field on selected drill core from the Property. Density of weathered spodumene bearing pegmatite and waste rock is taken from available data at Core property as of February 15, 2021.
Both Piedmont and SGS used the displacement method. Core fragments are typically 6 to 10 cm in length and 90 to 120 cm3 in volume. The Competent Person considers the values chosen to be suitably representative.
The bulk density for bulk material must have been measured by methods that adequately account for void spaces (vughs, porosity, etc.), moisture and differences between rock and alteration zones within the deposit.
Bulk density determinations are made on waste rock, saprolite and overburden. Moisture content of porous rock is determined from the change in mass after samples are dried. Void spaces were adequately accounted for by coating samples in cling film.
Discuss assumptions for bulk density estimates used in the evaluation process of the different materials.
For the Core Property, simple averages were generated for fresh pegmatite (2.71 t/m3), pegmatite saprolite (1.83 t/m3), overburden waste (1.31 t/m3), saprolite waste rock (1.32 t/m3) and amphibolite/metasedimentary country rock (2.88 t/m3).
For the Central Property, simple averages were generated for fresh pegmatite (2.84 t/m3), pegmatite saprolite (1.86 t/m3), overburden waste rock (1.23 t/m3), saprolite waste rock (1.36 t/m3) and country rock (2.95 t/m3).
For the Huffstetler Property, simple averages were generated for fresh pegmatite (2.70 t/m3), pegmatite saprolite (1.86 t/m3), overburden waste rock (1.30 t/m3), saprolite waste rock (1.36 t/m3) and country rock (2.84t/m3).
Classification
The basis for the classification of the Mineral Resources into varying confidence categories.
Mineral Resources at the Core and Central and properties have been classified as Indicated and Inferred on a qualitative basis; taking into consideration numerous factors such as: the validity and robustness of input data and the estimator’s judgment with respect to the proximity of resource blocks to sample locations and confidence with respect to the geological continuity of the pegmatite interpretations and grade estimates. All blocks captured in pegmatite dike interpretation wireframes below the topography surface are classified as Inferred. Indicated classification boundaries were generated that define a region of blocks that are informed by at least two drillholes and eight samples within a range of approximately 25 m to the nearest drillhole in the along strike or strike and downdip directions. No Measured category resources are estimated.
Whether appropriate account has been taken of all relevant factors (i.e. relative confidence in tonnage/grade estimations, reliability of input data, confidence in continuity of geology and metal values, quality, quantity and distribution of the data).
The classification reflects areas of lower and higher geological confidence in mineralized lithological domain continuity based on the intersecting drill sample data numbers, spacing and orientation. Overall mineralization trends are reasonably consistent within the various lithology types over numerous drill sections.
Whether the result appropriately reflects the Competent Person’s view of the deposit
The Core, Huffstetler and Central Property MREs appropriately reflect the Competent Person’s views of the deposit.
Audits or reviews
The results of any audits or reviews of Mineral Resource estimates.
The current model has not been audited by an independent third party.
Discussion of relative accuracy/ confidence
Where appropriate a statement of the relative accuracy and confidence level in the Mineral Resource estimate using an approach or procedure deemed appropriate by the Competent Person. For example, the application of statistical or geostatistical procedures to quantify the relative accuracy of the resource within stated confidence limits, or, if such an approach is not deemed appropriate, a qualitative discussion of the factors that could affect the relative accuracy and confidence of the estimate.
The accuracy of Mineral Resources for the Core, Central Huffstetler properties is communicated through the classification assigned to the deposit. The MRE has been classified in accordance with the JORC Code (2012 Edition) using a qualitative approach. All factors that have been considered have been adequately communicated in Section 1 and Section 2 of this Table.
The statement should specify whether it relates to global or local estimates, and, if local, state the relevant tonnages, which should be relevant to technical and economic evaluation. Documentation should include assumptions made and the procedures used.
By-product Mineral Resource statements for the Core, Central and Huffstetler relate to a global estimate of in-situ mineralized rock tonnes and estimated quartz by-product tonnage, estimated feldspar by-product tonnage comprising albite and K-spar minerals, and estimated muscovite mica by-product tonnage.
These statements of relative accuracy and confidence of the estimate should be compared with production data, where available.
There is no recorded production data for the Piedmont properties.
NEW YORK –
Piedmont Lithium Inc., (“Piedmont” or the “Company”) (NASDAQ: PLL; ASX: PLL), a clean energy company focused on the integrated production of lithium hydroxide to support the U.S. electric vehicle supply chain, today announced the appointment of Michael White as Executive Vice President and Chief Financial Officer. Reporting to the CEO, Keith Phillips, Mr. White brings deep accounting and finance experience to Piedmont, and will oversee the Company’s financial accounting and reporting, budgeting and forecasting, internal controls, compliance, treasury, tax, and risk management functions.
“We’re delighted to welcome Michael as our Chief Financial Officer and the newest member of our fast-growing leadership team,” said CEO, Keith Phillips. “We are entering an exciting phase for Piedmont as we prepare to allocate capital and ramp-up physical operations of our integrated lithium hydroxide business in North Carolina. Michael’s proven track record of developing and executing finance organizational strategy and solving complex business issues will be invaluable to us as we operate as a U.S. domiciled company. His background in controllership, corporate governance, public company reporting, financial planning and analysis and long-term strategic planning make him a great addition to our Piedmont family.”
Mr. White joins Piedmont from ChampionX Corporation (NASDAQ: CHX), formerly Apergy Corporation (NYSE: APY), a multi-billion-dollar manufacturing, chemicals, and services company, where he served as Vice President, Chief Accounting Officer and Corporate Controller with responsibilities for leading the company’s global accounting and financial reporting. In this role, Mr. White led enterprise-wide transformation of the global controllership function, created sustainable financial reporting with key performance metrics for operational leadership, and provided financial leadership related to mergers and acquisition activities, including a successful IPO. Prior to ChampionX, Mr. White held the position of Senior Vice President, Chief Accounting Officer and Corporate Controller for Aegion Corporation (NASDAQ: AEGN), a global manufacturing and services company serving the industrial, oil and gas and water industries. Mr. White has held senior financial leadership positions throughout his 25-year career with companies primarily in the energy and technology sectors, including roles as Chief Financial Officer of Baker Energy and as a manager in the assurance practice with Ernst & Young.
Mr. White earned his Bachelor of Science in Accounting and Finance from the University of Houston and is a licensed CPA and member of the American Institute of Certified Public Accountants.
About Piedmont:
Piedmont is developing a world-class integrated lithium business in the United States, enabling the transition to a net zero world and the creation of a clean energy economy in America. Our location in the renowned Carolina Tin Spodumene Belt of North Carolina, positions us to be one of the world’s lowest cost producers of lithium hydroxide and the most strategically located to serve the fast-growing U.S. electric vehicle supply chain. The unique geographic proximity of our resources, production operations and prospective customers, places Piedmont on the path to be the most sustainable producer of lithium hydroxide in the world and allow Piedmont to play a pivotal role in supporting America’s move to the electrification of transportation and energy storage. Additional information is available at www.piedmontlithium.com.
NEW YORK –
Piedmont Lithium Inc., (“Piedmont” or the “Company”) (NASDAQ: PLL; ASX: PLL), a clean energy company focused on the integrated production of lithium hydroxide to support the U.S. electric vehicle supply chain, today announced the election of two new Non-Executive Directors to its Board, Mr. Claude Demby and Ms. Susan Jones, along with the retirements of long-serving Directors Anastasios Arima and Levi Mochkin. “We are extremely fortunate to have individuals with the leadership and operating experience of Claude and Susan join our Board. Their relevant executive and governance backgrounds will play a key role in helping guide our organization as the demand for electric vehicles and lithium hydroxide rapidly increases in the United States and around the world,” said Piedmont Board Chairman, Jeff Armstrong.
Mr. Demby, currently President of Cree LED, a Smart Global Holdings, Inc. company, brings exceptional governance experience through his current service as Chair of the Governance and Nominating Committee and Director on the board of Brown Capital Management Mutual Fund Trust and prior service as Director on the board of the Federal Reserve Bank of Richmond – Charlotte branch, including Chairman from 2012 to 2017. He also has a strong record of community service through his founding and running of Valour Academy Schools, Inc., in Raleigh, NC, and serving as an advisory board member of Duke Raleigh Hospital.
Mr. Demby has extensive executive and operational leadership experience, having served as CEO and Director of the Noël Group, a $250 million manufacturer of synthetic foam materials, and President and COO of L&L Products, after beginning his career in engineering roles with Procter & Gamble and GE Plastics. “Claude’s work leading the LED Products business at Cree, developing technologies and services that have a broad environmental, social and governance impact, will be extremely valuable to Piedmont given our focus on serving the electric vehicle market, which will play a critical role in helping reduce the world’s carbon footprint,” said Mr. Armstrong. Mr. Demby received an MBA from Rensselaer Polytechnic Institute and a Bachelor of Chemical Engineering from the University of Delaware.
Ms. Jones spent 15 years of her career at Nutrien Ltd., a multibillion-dollar global mining and agricultural enterprise. Her most recent role prior to retirement in 2019 was serving as Executive Vice President and CEO – Potash, the world’s largest underground soft-rock miner. Ms. Jones has a wealth of board experience, having advised the boards of both Agrium and Nutrien, both NYSE publicly traded companies, as an executive, and currently serving on the board of TC Energy, a $50 billion market cap NYSE company, and Arc Resources. She has also served on the Boards of Gibson Energy and Canpotex.
Ms. Jones brings valuable legal experience combined with operating responsibilities over the course of her career with roles ranging from Chief Legal Officer to Managing Director of European Operations, and several other critical leadership positions. “Susan’s experience leading a global, vertically integrated, commodity company, combined with her extensive background in a variety of operational roles at Nutrien, will be an asset to Piedmont Lithium as we look to expand our business in the future,” added Mr. Armstrong. Ms. Jones received her JD from the University of Ottawa (Canada) and a BA in Political Science from the University of Victoria (Canada).
Piedmont CEO Keith Phillips commented, “As we welcome Susan and Claude, it is difficult to express how much we will miss and appreciate the vision and contributions that Taso and Levi brought to our organization to help us get to this point as a company. Mr. Arima is a visionary entrepreneur and was a co-founder of Piedmont Lithium, having identified both the economic and national security advantages of operating on the Carolina Tin-Spodumene Belt versus remote global locations. Taso is also the founder and CEO of Hyperion Metals, and is stepping back from the Piedmont board to dedicate all of his time to leading that new critical minerals venture. Mr. Mochkin has been a Board member and the Mochkin family trust has been Piedmont’s largest individual shareholder since the Company’s inception; his entrepreneurial guidance and wisdom together with being an unrelenting advocate of our story resonated with institutional and individual investors worldwide. We would not be where we are without them.”
About Piedmont:
Piedmont is developing a world-class integrated lithium business in the United States, enabling the transition to a net zero world and the creation of a clean energy economy in America. Our location in the renowned Carolina Tin Spodumene Belt of North Carolina, positions us to be one of the world’s lowest cost producers of lithium hydroxide and the most strategically located to serve the fast-growing U.S. electric vehicle supply chain. The unique geographic proximity of our resources, production operations and prospective customers, places Piedmont on the path to be the most sustainable producer of lithium hydroxide in the world and allow Piedmont to play a pivotal role in supporting America’s move to the electrification of transportation and energy storage. Additional information is available at www.piedmontlithium.com.
By clicking “Accept all cookies”, you agree to the storing of optional cookies on your device to enhance site navigation, analyze site usage, and assist in our marketing efforts. You can also learn more by clicking Privacy policy.Accept all cookiesNoPrivacy policy