Piedmont Lithium Inc. (“Piedmont” or the “Company”) is pleased to report the results of a Bankable Feasibility Study (“BFS”) for its 100% owned proposed integrated lithium hydroxide business (“Carolina Lithium” or the “Project”) in Gaston County, North Carolina. The Study confirms that Carolina Lithium could be one of the world’s largest and lowest-cost producers of lithium hydroxide, with a sustainability footprint that is superior to incumbent producers, all in a highly favorable location to supply the rapidly growing electric vehicle supply chain in the United States.
 | Lithium Hydroxide for the United States Electric Vehicle Market
|
 | Positive ESG Profile
|
 | Strong Financial Results Expected from Low Estimated Operating Costs
|
 | Opportunities for Further Economic Upside
|
EXECUTIVE SUMMARY
Piedmont’s Carolina Lithium Project is uniquely positioned to benefit from its highly favorable location in Gaston County, North Carolina, with exceptional infrastructure, a deep local talent pool, low-cost energy, and proximity to local markets for the monetization of by-product industrial minerals. The Study reflects more conservative costing assumptions than prior studies, with recent inflationary pressures having a substantial impact on both capital expenditures and operating costs. These cost impacts are partially offset using lithium pricing assumptions based on the more positive outlook incorporated in the consensus estimates described herein. Summary results of the Study are shown below.
The competitive advantage of Carolina Lithium’s unique location is depicted in the following lithium hydroxide cost curve, which was prepared by Roskill, a leading lithium industry consultancy.
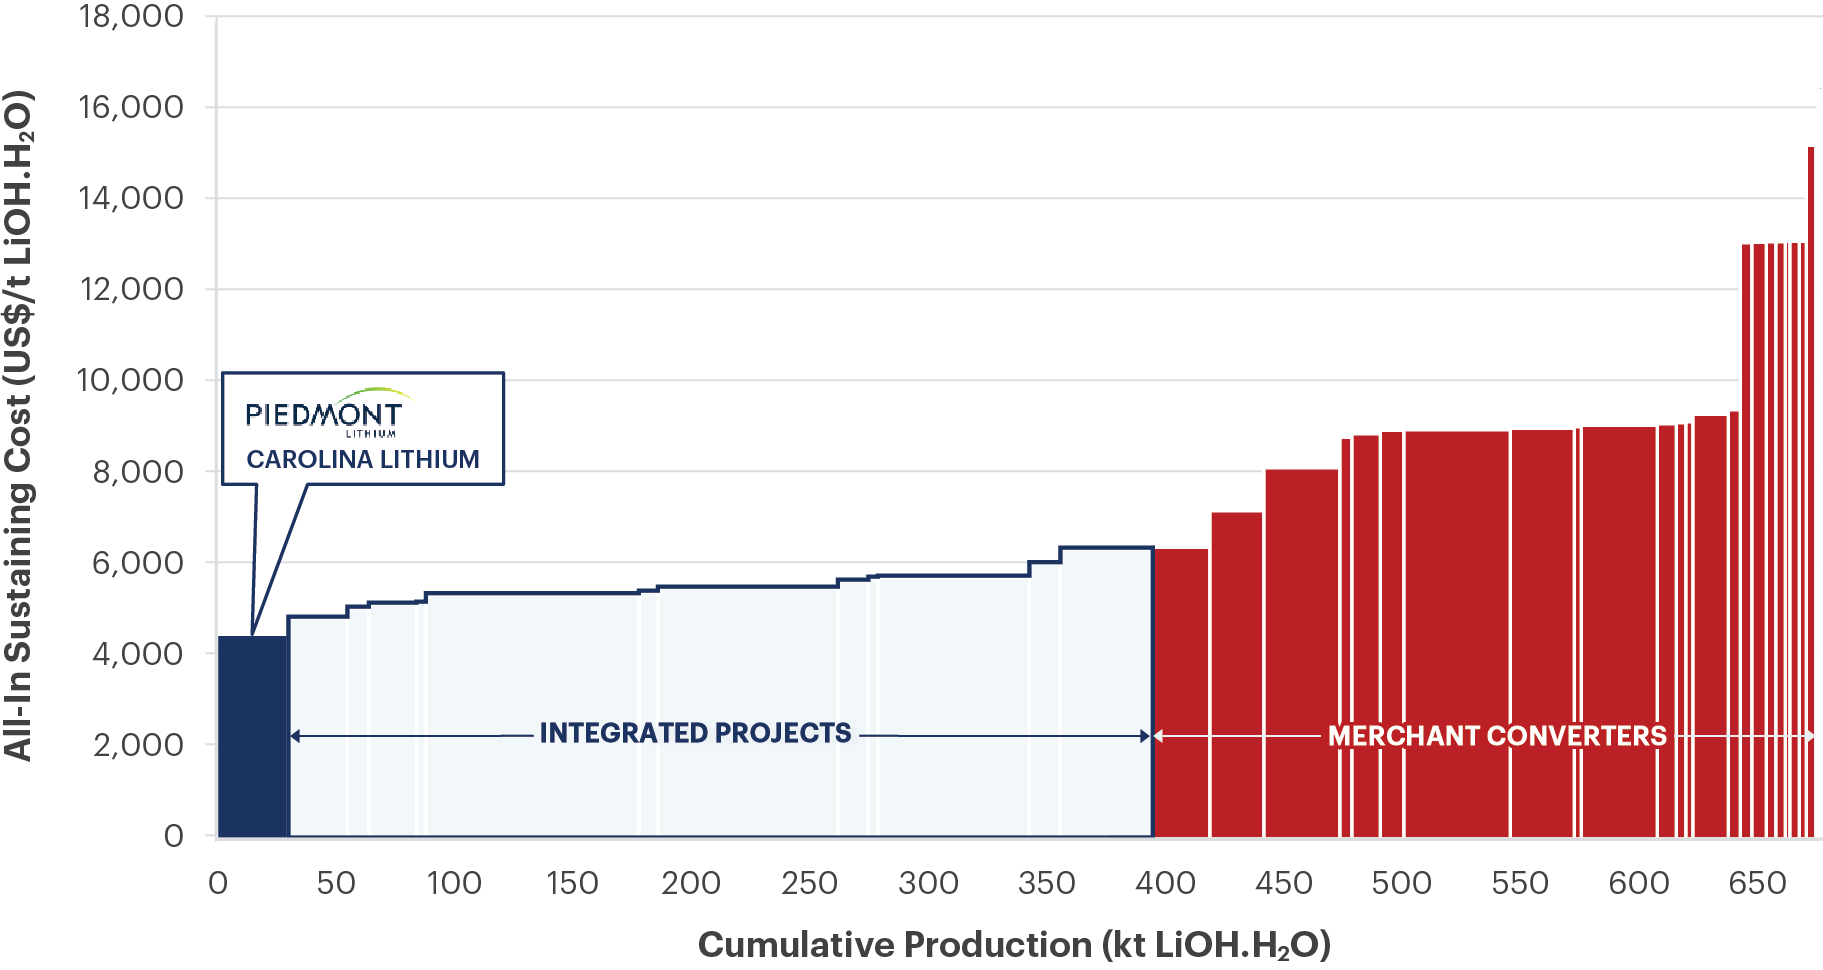
Figure 1 – Lithium hydroxide 2028 AISC cost curve (real basis) (Roskill) for Carolina Lithium BFS Production Case[4]
AISC includes all direct and indirect operating costs including feedstock costs (internal AISC), refining, corporate G&A and selling expenses.
Industry Leading Sustainability Profile
Carolina Lithium is expected to have a superior sustainability profile relative to current lithium hydroxide producers in China and South America. Chinese lithium producers are highly reliant on coal-fired power and generally utilize a carbon-intensive sulfuric acid roasting process to convert raw materials shipped in from Australia, while South American producers tend to utilize vast tracts of land and large quantities of water, all in the driest desert in the world, the Atacama.
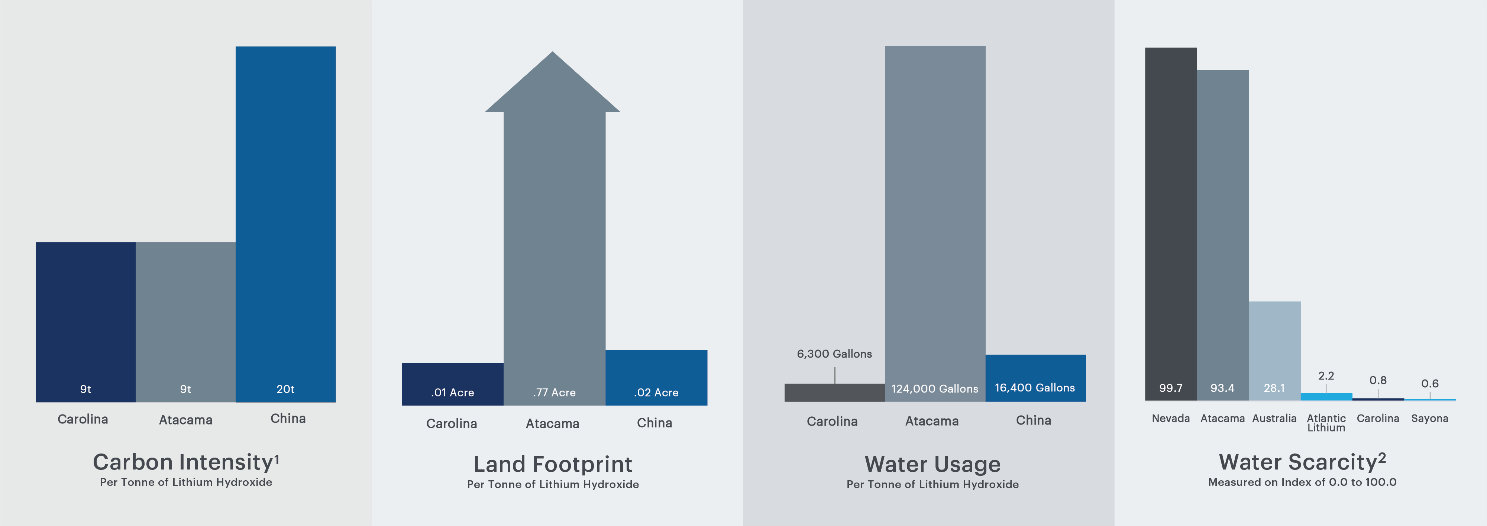
Figure 2 – Life cycle analysis of key carbon intensity, water usage, and land footprint of Carolina Lithium[5][6]
United States Market Dynamics
2021 has been a transformative year for electrification in the United States. Current and forecasted battery manufacturing capacity now exceeds 500 GWh with public announcements of over $25bb in capital investments to occur by 2025. Based on an average requirement of 960 t of lithium hydroxide per GWh of manufacturing capacity the resultant U.S. demand for lithium hydroxide could exceed 460,0000 t/y by 2027, dramatically exceeding the current development plans of domestic lithium companies.
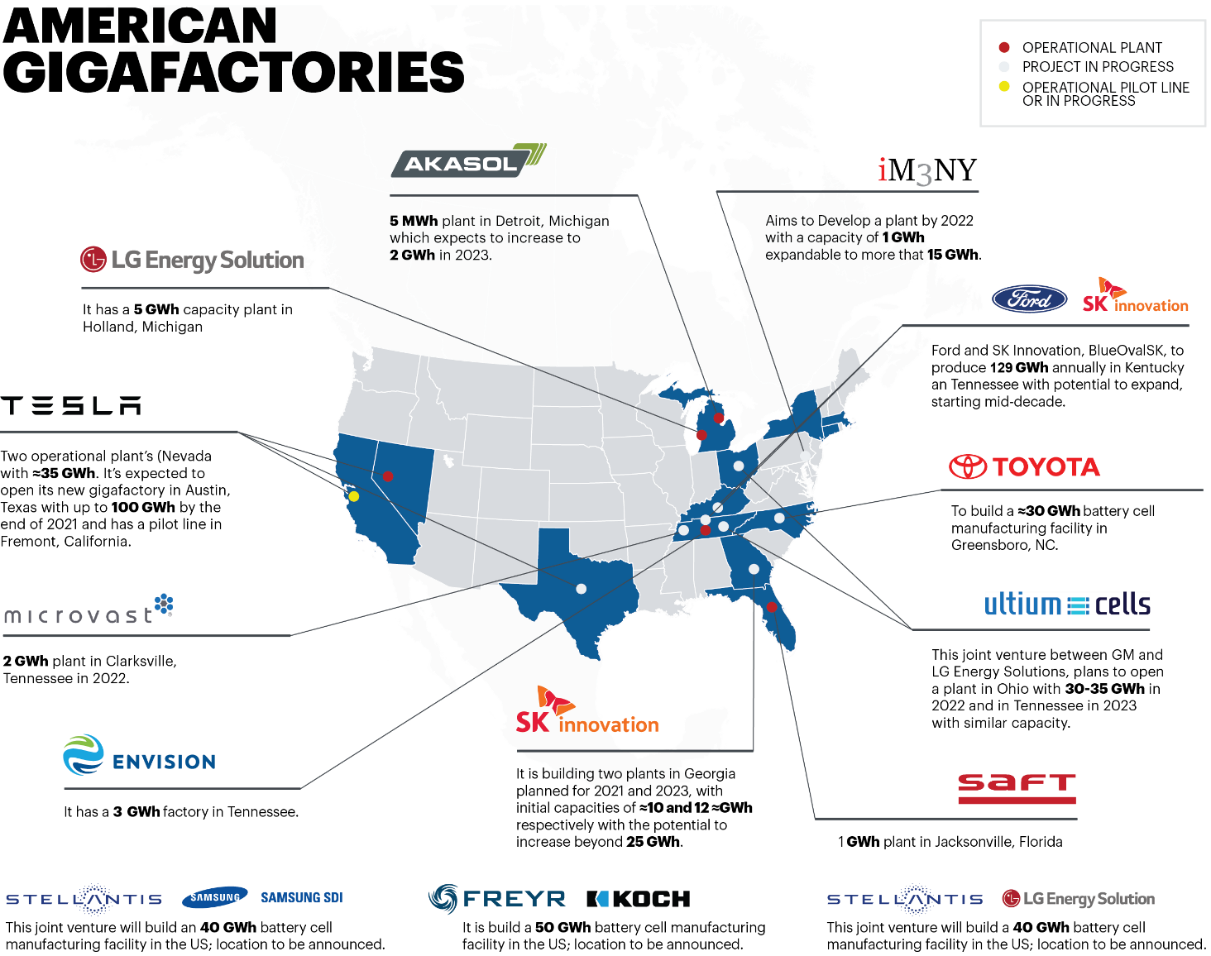
Figure 3 – Operating, Under Construction, or Announced U.S. Battery Manufacturing Capacity
Strong Estimated Financial Results with Potential for Extended Operational Life
The BFS prioritizes the production of the Company’s newly defined Probable Ore Reserves, which are calculated based upon compliance standards promogulated by the Joint Ore Reserve Committee (“JORC”) and those standards recently adopted by the United States Securities and Exchange Commission (SEC) via its rules issued under Regulation S-K, Item 1300. Following exhaustion of the Company’s Ore Reserves, chemical plant feed is assumed to be supplemented with ore obtained via the Company’s equity-backed offtake agreements or other spodumene concentrate purchased from the market.
The production target outlined in the BFS is limited to the Company’s Probable Ore Reserves. Table 1 summarizes the financial outcomes of the BFS Ore Reserves production scenario.
| Table 1: Summary BFS Financial Outcomes | Unit | Ore Reserves Production Scenario |
|---|---|---|
| Operational Life | ||
| Lithium Hydroxide Plant Operation Life | years | 30 |
| Ore Reserve Life | years | 11 |
| Financial Performance | ||
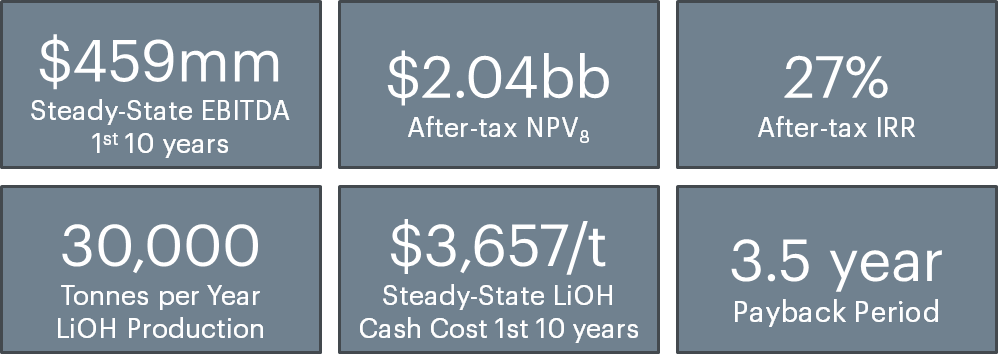
| Average annual steady state EBITDA – first 10 years | $mm/y[7] | $459 |
| Average annual steady state EBITDA – life of operations | $mm/y | $346 |
| Average annual steady state after-tax cash flow – first 10 years | $mm/y | $296 |
| Average annual steady state after-tax cash flow – life of operations | $mm/y | $244 |
| After tax Net Present Value (“NPV”) @ 8% discount rate | $mm | $2,041 |
| After tax Internal Rate of Return (“IRR”) | % | 27% |
The BFS emphasizes an initial production target of 11 years of spodumene concentrate to be processed at the Company’s chemical plant which will be located adjacent to mining operations. The BFS incorporates assumptions of additional lithium hydroxide production sourced from equity-backed offtake agreements, discussed below, which allow the Company to secure spodumene from alternate sources, increasing the chemical plant life to 30 years.
Multi-Asset Business with Upside Potential
Strategic investments in logistically advantaged, high quality spodumene projects have transformed Piedmont Lithium in 2021 from a single project company to a multi-jurisdictional business with access to spodumene concentrate from multiple sources.
Piedmont Lithium holds a 25% equity interest in Sayona Quebec and North American Lithium along with a 50% offtake right to spodumene concentrate produced by Sayona Quebec on a life-of-mine basis.
Additionally, Piedmont Lithium has an earn-in right to acquire a 50% interest in Atlantic Lithium’s Ghanaian project portfolio including the Ewoyaa Project. Along with this equity earn-in right Piedmont holds a 50% offtake right to spodumene concentrate produced by Atlantic Lithium on a life-of-mine basis.
Offtake rights provide Piedmont Lithium the flexibility to extend the operational life of Carolina Lithium, or to increase lithium hydroxide production capacity through construction of a Phase 2 Lithium Hydroxide Conversion Plant.
The Company expects to publish additional technical studies in 2022 evaluating potential expansion cases for Phase 2 Lithium Hydroxide Operations.
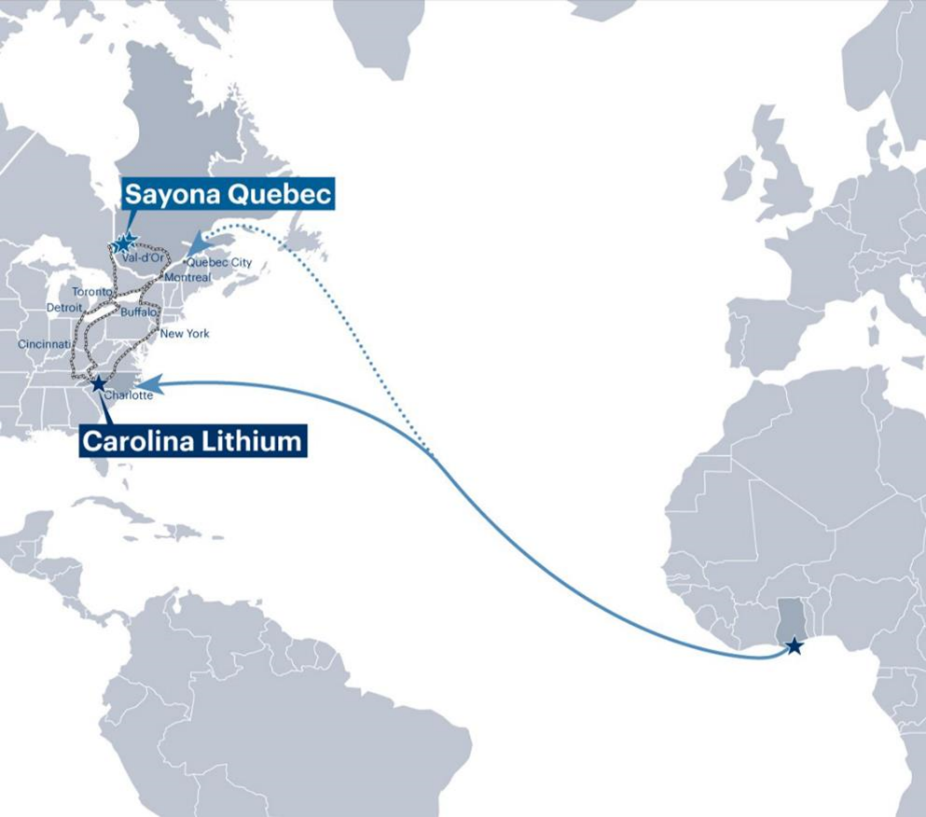
Figure 4 – Piedmont holds spodumene concentrate offtake rights along with project investments in multiple jurisdictions
Fully Integrated Manufacturing Campus
- Carolina Lithium contemplates a single, integrated site, comprising quarrying, spodumene concentration, by-products processing, and spodumene conversion to lithium hydroxide. There are currently no such integrated sites operating anywhere in the world, and the economic and environmental advantages of this strategy are compelling:
- Premier location in Gaston County, North Carolina – “the cradle of the lithium business”
- Integrated site eliminates unnecessary SC6 transportation costs and truck movements
- Electric powered conveyors eliminate mine trucks, reduce noise, dust and diesel-based CO2 emissions
- On-site solar complex to power concentrate operations
- Potential to co-locate downstream battery materials, Li-ion battery manufacturing, and by-product customers
- Creation of up to 500 permanent manufacturing, engineering, and management jobs (Phase 1)
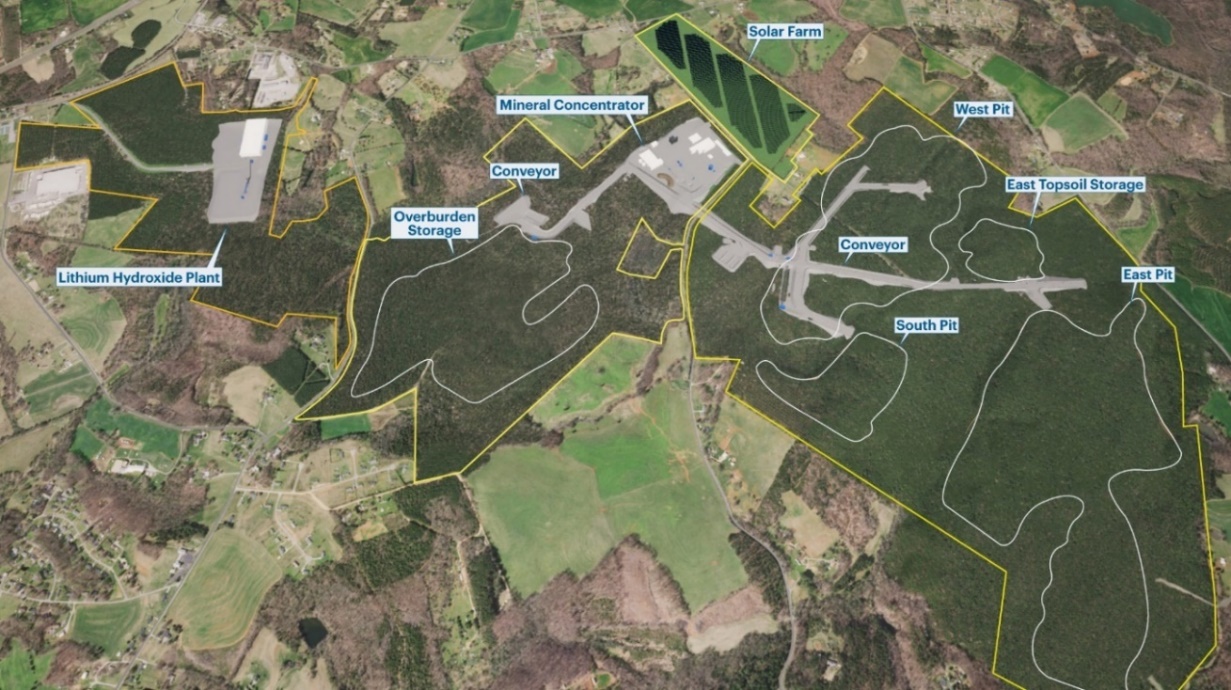
Figure 5 – Site plan for the planned permit area of the Phase 1 30,000 t/y Carolina Lithium operations

“We are exceedingly pleased with the results of the BFS for the Carolina Lithium Project, which we believe confirm the Project’s industry-leading sustainability profile as well as exceptional economics while incorporating the substantial capital and operating cost inflation experienced during 2021.
We will soon commence detailed engineering for the Project with a view to a final investment decision in 2022. We are actively engaged in project financing discussions, including possible debt finance via the U.S. Department of Energy’s Advanced Technology Vehicle Manufacturing loan program, and potential strategic equity investments via the partnering process being coordinated by our financial advisors.
An important priority for 2022 will be the evaluation of expansion opportunities incorporating the spodumene concentrate assets we control in Quebec and in Ghana. Our ambition is to build America’s largest lithium hydroxide business, and the spodumene resource base we’ve assembled during 2021 should underpin substantial growth.”
Keith D. Phillips, President and Chief Executive Officer
CAROLINA LITHIUM 30,000 T/Y BANKABLE FEASIBILITY STUDY
Piedmont’s fully integrated Carolina Lithium Project’s Bankable Feasibility Study (“BFS”) is based on the Company’s Mineral Resource estimate reported in October 2021, of 44.2 Mt at a grade of 1.08% Li2O and the by-product Mineral Resource estimates comprising 7.4 Mt of quartz, 11.1 Mt of feldspar and 1.1 Mt of mica reported in June 2021. This announcement is intended to alert investors to the conversion of 18.3 million metric tons of previously categorized spodumene Mineral Resources (undiluted basis) to Probable Ore Reserves and to report the results of technical study of the production of battery grade lithium hydroxide from these Ore Reserves and other sources.
The BFS emphasizes an initial Ore Reserves only production target of 11 years of spodumene concentrate to be processed at the Company’s chemical plant which will be located adjacent to mining operations. The BFS incorporates assumptions of additional lithium hydroxide production sourced from offtake agreements which allow the Company to secure spodumene from alternate sources, increasing the chemical plant life to 30 years. Table 2 summarizes project outcomes under the BFS.
There remains significant opportunity to increase the operational life of Carolina Lithium beyond 11 years by conversion of existing mineral resources to ore reserves or by discovery of additional resources within the TSB within a reasonable trucking or conveying distance to the proposed concentrator.
| Table 2: BFS Summary Outcomes for the Carolina Lithium Project | Unit | Ore Reserves Scenario |
|---|---|---|
| Capital Costs | ||
| Mining | $mm | $81 |
| Concentrator | $mm | $162 |
| Byproducts | $mm | $45 |
| Lithium hydroxide conversion plant | $mm | $408 |
| Project indirects | $mm | $99 |
| Owner’s costs | $mm | $73 |
| Contingency | $mm | $120 |
| Total initial capital cost | $mm | $988[8] |
| Sustaining, working and deferred capital | $mm | $351 |
| Financial Performance | ||
| Average annual steady state EBITDA – first 10 years | $mm/y | $459 |
| Average annual steady state EBITDA – life of operations | $mm/y | $346 |
| Average annual steady state after-tax cash flow – first 10 years | $mm/y | $296 |
| Average annual steady state after-tax cash flow – life of operations | $mm/y | $244 |
| After tax Net Present Value (“NPV”) @ 8% discount rate | $mm | $2,041 |
| After tax Internal Rate of Return (“IRR”) | % | 27% |
| Payback from start of operations | years | 3.5 |
Updates from Prior Studies
The BFS represents a significant advancement in project definition compared with the Company’s previously announced Scoping Study update announced in June 2021. Estimate accuracy has been improved between June and December 2021 from ±35% to ±15%. Significant changes have occurred in lithium market conditions and product pricing, while inflationary pressures have contributed to increases in estimated project capital and operating costs.
| Table 3: Comparative Outcomes of BFS and June 2021 Scoping Study Update | |||
|---|---|---|---|
| Outcomes | Unit | BFS | June 2021 SSU |
| Chemical Plant life | years | 30 | 20 |
| Spodumene concentrate production[9] | years | 11 | 20 |
| Steady-state average annual LiOH production | kt/y | 30 | 30 |
| Steady-state average annual SC6 production | kt/y | 242 | 248 |
| Steady-state average annual by-product production | kt/y | 672 | 714 |
| Long term lithium hydroxide price | $/t | $18,000 | $15,239 |
| Long term spodumene concentrate price | $/t | $900 | $762 |
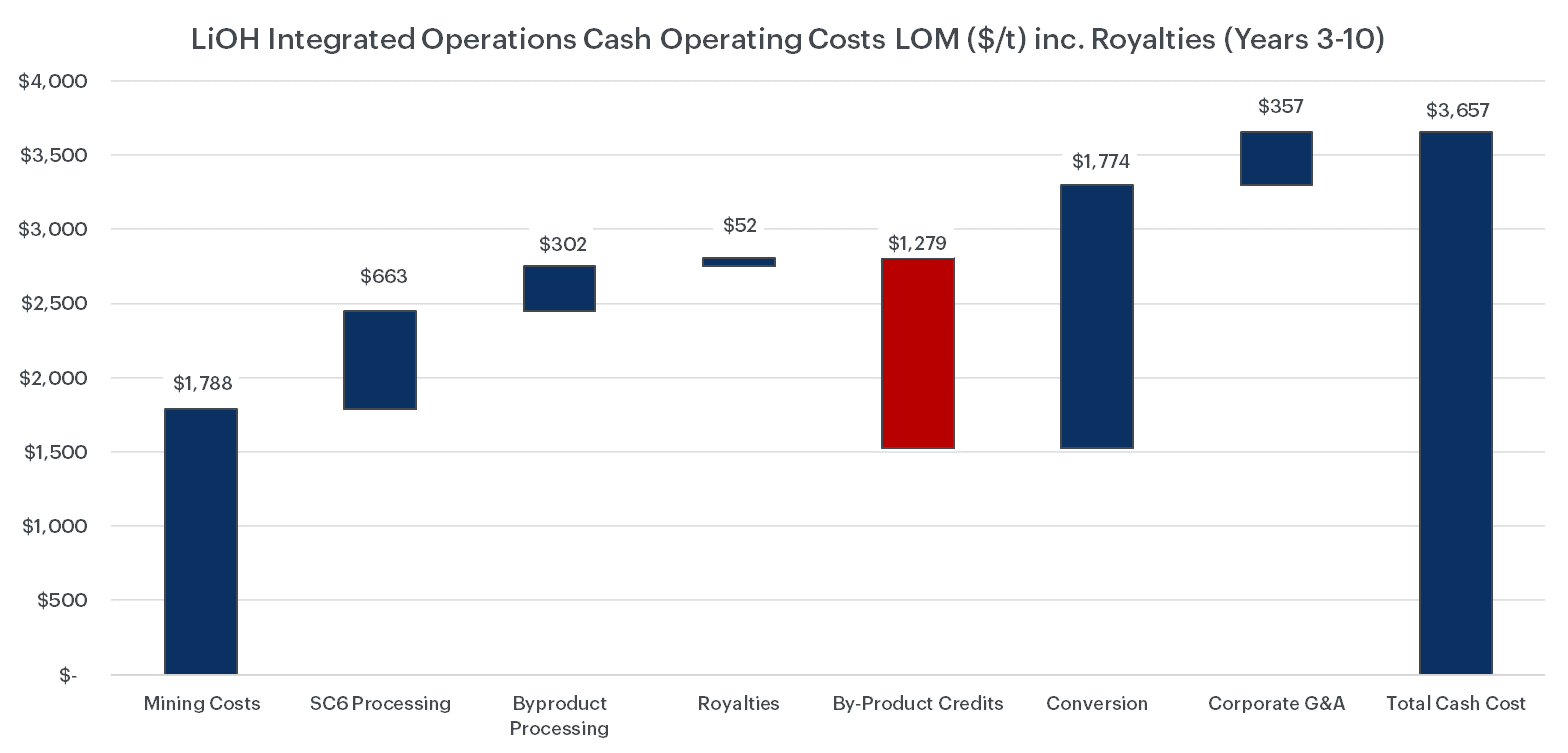
| Steady-state average cash cost of LiOH production | $/t | $3,657[10] | $2,943 |
| Steady-state average cost of SC6 production | $/t | $234[11] | $181 |
| Initial capital cost (including contingency) | $mm | $988 | $838 |
| Steady-state average annual EBITDA | $mm/y | $459[12] | $401 |
| After tax NPV @ 8% discount rate | $mm | $2,041 | $1,923 |
| After tax IRR | % | 27% | 31% |
| Payback from start of operations | years | 3.5 | 2.9 |
BFS Consultants
The results of the BFS incorporate expertise and input from multiple industry experts and consultants of the Company. A Technical Report Summary (TRS) of the BFS will be filed prior to the release of the Company’s next quarterly filing, currently anticipated by the end of February 2022, which would allow the Company to express Ore Reserves in accordance with JORC and S-K 1300 standards.
| Table 4: BFS Consultants | |
| Consultant | Scope of Work |
| Primero Group Americas Inc. | Concentrate operations and overall BFS integration |
| Metso Outotec | Lithium hydroxide manufacturing technology package; LiOH pilot testwork |
| SGS Canada Inc. | Concentrate and byproducts metallurgical testwork |
| Marshall Miller and Associates | Mine design and scheduling; estimation of Ore Reserves |
| McGarry Geoconsulting Corp. | Mineral Resource estimation |
| HDR Engineering, Inc. | Permitting, environment, and social studies |
| Johnston, Allison, and Hord | Land title and legal |
| Benchmark Mineral Intelligence | Lithium products marketability |
| John Walker | By-products marketability |
Feasibility Study Overview
Piedmont holds a 100% interest in the Carolina Lithium Project located within the Carolina Tin-Spodumene Belt (“TSB”) and along trend to the Hallman Beam and Kings Mountain mines, which historically provided most of the western world’s lithium between the 1950s and the 1980s. The TSB has been described as one of the largest hard rock lithium regions in the world and is located approximately 25 miles west of Charlotte, North Carolina.
The Company has previously reported a global Mineral Resource estimate (“MRE”) for the Project of 44.2Mt grading at 1.08% Li2O. As of the date of our most recent 10-K filing, Piedmont has completed 599 drill holes on these properties totaling 88,185 meters to date spanning five drill campaigns. The BFS[13] only considers mining of the company’s Core Property and results in the conversion of approximately 18 million tons of previously categorized Indicated Mineral Resources to Probable Ore Reserves.
The Project is located in a rural area of Gaston County, North Carolina, USA approximately 25 miles northwest of the city of Charlotte. As of October 31, 2021, the Project comprised approximately 3,245 total acres, of which 1,526 acres are claims on private property through option or deferred purchase agreements, 113 acres are under a long-term mineral leased agreement, 79 acres are under lease to own agreements, and 1,527 acres are owned by Piedmont. For the properties hosting the Mineral Resources in this report, Piedmont controls 100% of the surface and mineral rights per one or more agreement scenarios.
On August 31, 2021 Piedmont submitted a mine permit application to the North Carolina Department of Environmental Quality’s (“NCDEQ”) Division of Energy, Minerals and Land Resources (“DEMLR”) covering 1,548 acres of the Project’s total land package. Ore Reserves are inclusive of tons within the mine permit application. Additionally, ore reserves and mine planning summarized in this announcement include a smaller portion of tons contained within currently controlled properties which are anticipated to be permitted and mined via future permit boundary revisions. Additional property acquisitions, the costs of which are included in BFS financials, would allow permit boundary revisions to capture these additional reserve tons. In addition to further property acquisitions which are needed to expand permit boundaries, the project will require additional waste storage volume which is not currently included in the permit application. The Company currently controls tracts of land which are contiguous to the permitted areas that could be utilized for additional waste material storage without sterilizing reserves as expressed in this BFS.
The BFS supplements production of the Company’s Ore Reserves with ore secured via interests and offtake agreements with Sayona Quebec and Atlantic Lithium. As part of the BFS financial modelling, the Company and its Consultants confirmed the economic viability of its controlled Ore Reserves absent the impact of offtake tonnages. Further details are included in the announcement’s appendix.
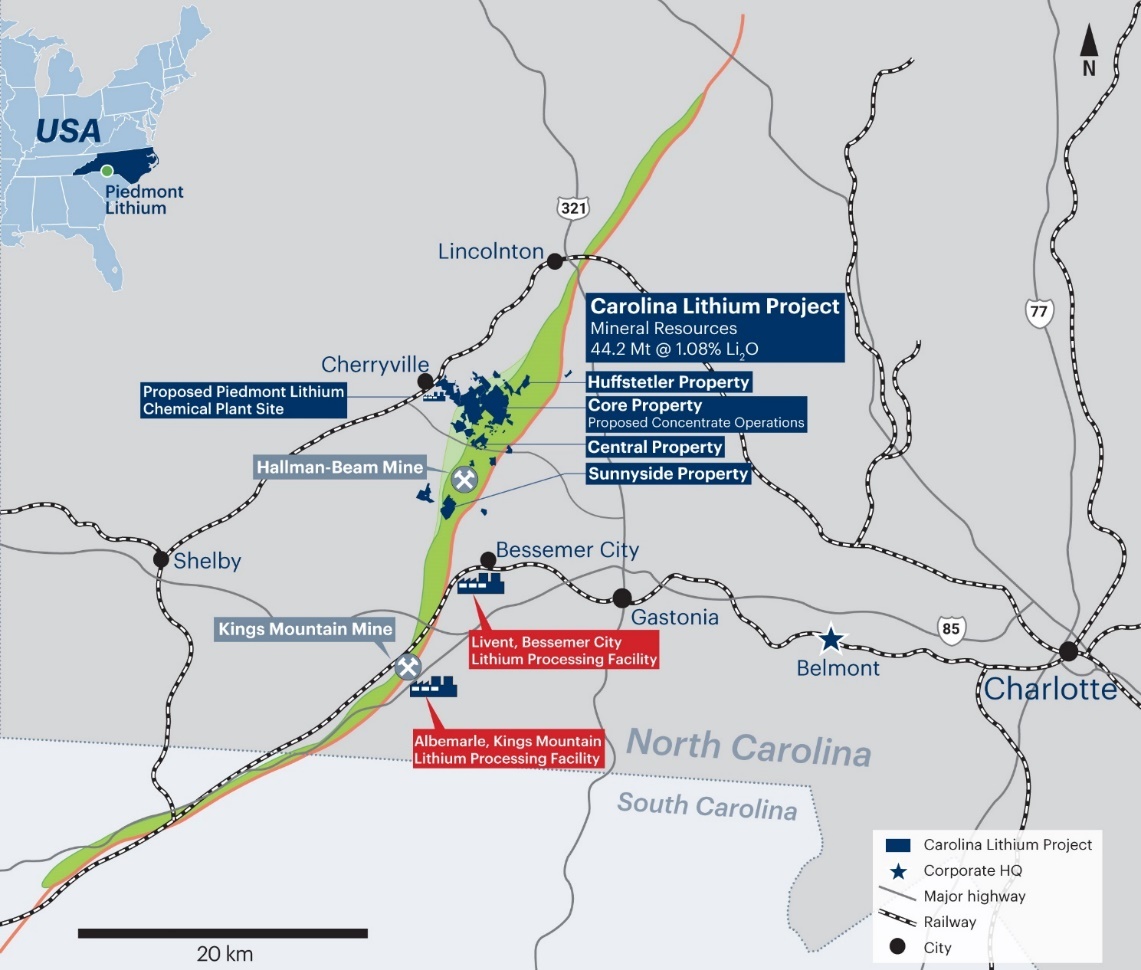
Figure 6 – Piedmont’s Carolina Lithium Project located within the TSB
Mineral Resource Estimates
On October 21, 2021 the Company announced an updated MRE prepared by independent consultant McGarry Geoconsulting Corp. (“McGarry Geo”) in accordance with the U.S. Securities and Exchange Commission’s Regulation S-K, Item 1300 (“S-K 1300”) and the JORC Code (2012 Edition). The total lithium Mineral Resources reported by Piedmont for the Carolina Lithium Project are 44.2 Mt grading at 1.08% Li2O.
| Table 5: Carolina Lithium Project – Summary of Mineral Resources Estimate at October 20, 2021 | |||||||
| Resource Category | Tonnes
(Mt) | Grade
(Li2O%) | Li2O
(t) | LCE
(t) | LiOH·H2O
(t) | Cut-Off Grade (% Li2O) | Metallurgical Recovery
(%)[14] |
| Indicated | 28.2 | 1.11 | 313,000 | 774,000 | 879,000 | 0.4 | 71.2 |
| Inferre | 15.9 | 1.02 | 162,000 | 401,000 | 455,000 | ||
| Total | 44.2 | 1.08 | 475,000 | 1,175,000 | 1,334,000 | ||
On October 21, 2021 the Company announced updated MREs for by-products quartz, feldspar, and mica. The results are shown in Table 6. The by-product MRE’s have been prepared by independent consultants, McGarry Geo and are reported in accordance with requirements of S-K 1300 and the JORC Code (2012 Edition). The economic extraction of by-product minerals is contingent on Piedmont’s economic extraction of lithium Mineral Resources. Accordingly, the by-product Mineral Resource estimates are reported at a 0.4% Li2O cut-off grade, consistent with the reported lithium MRE.
Ore Reserves
An estimate of Ore Reserves was made following detailed mine planning completed during the BFS and is based on the Indicated Mineral Resources contained within the Project’s Core Property. The Ore Reserves have been estimated in accordance with the requirements of S-K 1300 and the JORC Code. Section 4 of Table 1 of the JORC Code appear in the Appendices to this announcement.
| Table 7: Carolina Lithium Project – Estimate of Ore Reserves (undiluted) | |||||||
| Ore Reserves Category | Tonnes
(Mt) | Grade
(Li2O%) | Li2O
(t) | LCE
(t) | LiOH·H2O
(t) | Cut-Off Grade (% Li2O) | Metallurgical Recovery
(%)[15] |
| Proven | – | – | – | – | – | 0.4 | 70.1 |
| Probable | 18.26 | 1.10 | 200,000 | 495,000 | 562,000 | ||
| Total | 18.26 | 1.10 | 200,000 | 495,000 | 562,000 | ||
The Qualified and Competent Persons responsible for the derivation of Probable Ore Reserves have considered pertinent modifying factors, inclusive of geological, environmental, regulatory, and legal factors, in converting a portion of the Mineral Resource to Mineral Reserve. Probable Ore Reserves, derived from previously stated Indicated Mineral Resources, incorporate reasonable expectations of costs and performance. Historic mining ventures in the TSB yield additional confidence in the likelihood of a successful mining project. The Qualified and Competent Persons have considered the rules and regulations promulgated by the Joint Ore Reserve Committee and US Securities and Exchange Commission in estimating Ore Reserves. The Qualified and Competent Persons find the assumptions and modifying factors utilized for the BFS to be sufficient and satisfactory in the delineation of Probable Ore Reserves based upon JORC and S-K 1300 regulations.
Ore Reserves Classification Criteria
All converted Mineral Resources were classified as Probable Ore Reserves. There were no Measured Mineral Resources defined that could be converted into Proven Ore Reserves and no Inferred Mineral Resources were included in the estimation of Ore Reserves.
Ore Reserves Cut-Off Parameters
Cutoff grade of 0.4% Li2O was used in creation of the block model supplied by McGarry Geoconsulting Corp.
Ore Reserves Mining Factors
An open pit mining method was selected due to the ore body outcropping in several places along the surface. No other mining method was evaluated as part of the Ore Reserves estimation.
Mine design parameters include overburden batter angle in unconsolidated material of 27 degrees, face batter angle of 75 degrees, inter-ramp slope of 57 degrees, overall slope of 51 degrees, berm width of 9.5 meters, berm height working 12 meters, berm height final wall of 24 meters, ramp width of 30 meters, ramp grade of 10%, mine dilution of 10%, process recovery of 77%, and minimum mining width of 50 meters.
Ore Reserves Metallurgical Factors
In 2019, Piedmont engaged SGS Canada Inc. in Lakefield, Ontario to undertake testwork on variability and composite samples. Dense Medium Separation (“DMS”) and locked-cycle flotation tests produced high-quality spodumene concentrate with a grade above 6.0% Li2O, iron oxide below 1.0%, and low impurities from composite samples.
In 2021, Piedmont engaged SGS Canada Inc. in Lakefield, Ontario to undertake testwork on nine variability samples. Samples were produced from drill core from the East and South pits and represented the early years of production (i.e., the first 10 years of operation). The samples generally contained elevated levels of host rock dilution (ranging from 9.4% to 17.3%) as compared to the mine plan average (10%). DMS and batch and locked-cycle flotation tests were undertaken. Based on the historical testwork and the 2021 variability program, the BFS assumes a spodumene recovery of 77.0% for a diluted head grade of 0.996% Li2O when targeting a 6.0% Li2O spodumene concentrate product.
Ore Reserves Revenue Factors
The BFS assumes a fixed price of $18,000/t for battery quality lithium hydroxide and $900/t for spodumene concentrate (SC6).
Ore Reserves Cost Factors
Capital costs include estimates for infrastructure development including roads, electrical power delivery and distribution, water sources for plant and dust control and initial site development based on contractor responses to requests for proposal based on BFS level engineering.
Operating costs were established using budget pricing from mining contractors based on a request for proposal issued by Marshall Miller and Associates combined with first-principles estimates for utilities including electrical service from Duke Energy.
Costs were estimated on a 2021 U.S. dollars basis in real terms. Royalties of $1.00 per ROM tonne are based on the average land option agreement.
Mining Production Target
Pit optimizations were completed by Marshall Miller & Associates in order to produce a production schedule on a quarterly basis for the first five years of operations and on an annual basis thereafter. This resulted in a total production target of approximately 2.56 Mt of 6.0% Li2O spodumene concentrate (“SC6”), averaging approximately 242,000 t/y of SC6 over the 11-year ore reserve life. This equates to a steady state average of 1.90 Mt/y of ore processed, totaling approximately 20.1 Mt of run-of-mine (“ROM”) ore at an average fully diluted ROM grade of 1.0% Li2O (diluted) over the 11-year ore reserve life.
The BFS assumes concentrate operations production life of 11 years (matching ore reserves) and chemical plant operations life of 30 years, commencing in year 1 of the Project. It is assumed that concentrate operations including by-products will commence about 90 days in advance of chemical plant start-up to build initial SC6 inventory. Produced SC6 which exceeds chemical plant capacities are assumed to be sold to third parties during the life of the Project. Of the total production target of 2.56 Mt of SC6, approximately 0.56 Mt will be sold to third parties during the operational life and approximately 2.0 Mt will be supplied to Piedmont’s chemical plant operations for conversion into lithium hydroxide.
The Study assumes production targets of 2.68 Mt of quartz concentrate, 4.17 Mt of feldspar concentrate, and 0.30 Mt of mica concentrate over the life of operations based on the potential recovery of these products from the concentrator flotation circuits and the Company’s analysis of domestic industrial minerals markets and engagement with prospective customers.
There remains significant opportunity to increase the operational life of Carolina Lithium beyond 11 years by conversion of existing mineral resources to ore reserves or by discovery of additional resources within the TSB within a reasonable trucking or conveying distance to the proposed concentrator. Reserves delineated as part of the BFS only consider the Company’s Core Property and are predominately limited to those tons which are captured by current permit applications. Significant upside exists via the potential future conversion of other resources to reserves, the impact of which is not captured in the BFS economics.
Chemical Plant Production
The lithium hydroxide plant is assumed to operate for 30 years, with 2.0 Mt of SC6 delivered from Carolina Lithium’s concentrate operations from years 1-11 and 3.9 Mt of SC6 delivered from third party spodumene concentrate purchases from years 12-30, resulting in a total production target of approximately 883,000 tonnes of battery quality lithium hydroxide, averaging approximately 29,400 t/y of lithium hydroxide over the 30-year production life.
Third party purchases of spodumene concentrate may include procurement of SC6 from Sayona Quebec, where Piedmont Lithium holds offtake rights to the greater of 113,000 t/y or 50% of SC6 production on a life-of-mine basis. SC6 may also be delivered from Atlantic Lithium, where Piedmont Lithium holds a 50% offtake right, currently forecasted as 147,500 t/y SC6 production for life-of-mine. The BFS project financials do not capture potential financial gains from Piedmont’s equity interests in Sayona Quebec or Atlantic Lithium.
Mining Optimization
Independent consultants Marshall Miller and Associates used Maptek Vulcan and Evolution to generate a series of economic pit shells using the updated Mineral Resource block model and input parameters as agreed by Piedmont. Overall slope angles in rock were estimated following a preliminary geotechnical analysis that utilized fracture orientation data from oriented core and downhole geophysics (Acoustic Televiewer), as well as laboratory analysis of intact rock strength. The preliminary geotechnical assessment involved both kinematic and overall slope analyses utilizing Rocscience™ modeling software.
Overall slope angles of 27 degrees were assumed for overburden and oxide material. Overall slope angles of 51 degrees were estimated for fresh material which includes a ramp width of 30 meters. Production schedules were prepared for the Project based on the following parameters:
- A targeted run-of-mine production of 1.9 Mt/y targeting concentrator output of about 242,000 t/y of SC6
- Mining dilution of 10%
- Mine recovery of 100%
- Concentrator processing recovery of 77%
- Mine sequence targets utilized Proven and Probable reserves for the schedule
The results reported are based upon a scenario which utilizes extraction of Probable reserves from property currently under mine permit application filed with NC DEMLR and additional controlled tonnes which are anticipated to be added to the permit following additional property acquisitions. These tonnes are currently excluded from the permit due to geometric constraints and offset requirements, but are anticipated to be permitted in the future. Table 8 shows the production target.
Production Schedule
A mine design has been prepared based on delivery of ore reserves to the spodumene concentrator. The open pit design incorporates the production schedule on a quarterly basis for the first five years and then annually for the remaining life of mine. Access ramps, ramp widths, conveyor passes, batter angles, berm widths, berm heights, mine permit limits, zoning permit requirements, and jurisdictional buffers from flood zones, streams and wetlands not permitted for disturbance were all incorporated into the mine design.
Metallurgical Testwork
Concentrate Metallurgy
In 2019, Piedmont engaged SGS Canada Inc. in Lakefield, Ontario to undertake testwork on variability and composite samples. Dense Medium Separation (“DMS”) and locked-cycle flotation tests produced high-quality spodumene concentrate with a grade above 6.0% Li2O, iron oxide below 1.0%, and low impurities from composite samples. Table 10 shows the results of composite tests on the preferred flowsheet (previously announced on July 17, 2019). The feed grade of the composite sample was 1.11% Li2O.
In 2020, a pilot plant testwork program was undertaken at SGS Canada Inc. A 54-t bulk outcrop sample from the Carolina Lithium Project was processed through a DMS and flotation pilot plant. Using the optimized results from the flotation pilot plant, the combined DMS and flotation concentrates graded >6% Li2O and <1% Fe2O3 with lithium recoveries >70%. Optimized testing on the master composite sample resulted in lithium recovery of 82% and concentrate grading 6.13% Li2O.
In 2021, Piedmont engaged SGS Canada Inc. in Lakefield, Ontario to undertake testwork on nine variability samples. Samples were produced from drill core from the East and South pits and represented the early years of production (i.e., the first 10 years of operation). The samples generally contained elevated levels of host rock dilution (ranging from 9.4% to 17.3%) as compared to the mine plan average (10%). DMS and batch and locked-cycle flotation tests were undertaken. Table 11 shows the composition of the nine variability samples and combined (DMS and flotation) concentrate grades and spodumene recoveries which were estimated based on feed mineralogy.
Based on the historical testwork and the 2021 variability program, the BFS assumes a spodumene recovery of 77.0% for a diluted head grade of 0.996% Li2O when targeting a 6.0% Li2O spodumene concentrate product.
By-Product Metallurgy
The production of bulk quartz and feldspar concentrates as by-products from the spodumene locked-cycle flotation tailings was investigated. Six individual batch tests were conducted with the quartz and feldspar concentrates being composited. The results of these tests are provided in Table 12 (results previously announced May 13, 2020). Additional by-product testwork in conjunction with BFS is ongoing.
Piedmont engaged North Carolina State University’s Minerals Research Laboratory in 2018 to conduct bench-scale testwork on samples obtained from the Company’s MRE within the Core Property for by-products quartz, feldspar, and mica. The objective of the testwork program was to develop optimized conditions for spodumene flotation and magnetic separation for both grade and recovery. Summary mica concentrate data are shown in Table 13. Complete mica data were previously announced on September 4, 2018. Further mica product optimization is in progress in conjunction with the BFS.
Mica quality is measured by its physical properties including bulk density, grit, color/brightness, and particle size. The bulk density of mica by-product generated from Piedmont composite samples was in the range of 0.680 – 0.682 g/cm3.
The National Gypsum Grit test is used mostly for minus 100 mesh mica which is used as joint cement compound and textured mica paint. Piedmont sample grit results were in the range of 0.70 – 0.79%, well below the typical specification for total grit in mica of 1.0%. Color/brightness is usually determined on minus 100 mesh material. Several instruments are used for this determination including the Hunter meter, Technedyne and the Photovoltmeter. The green reflectance is often reported for micas and talcs. Piedmont Green Reflectance results were in the range of 11.2 – 11.6.
Quartz and feldspar concentrates were produced during the 2021 Variability program at SGS Canada Inc. Batch flotation tests were operated to produce feldspar concentrate with the flotation tailings passed through wet high-intensity magnetic separation to produce quartz concentrate. Table 14 and Table 15 show assays for the feldspar and quartz concentrates produced from optimized variability batch tests.
Conversion Metallurgy
In 2021, Piedmont engaged Metso Outotec to undertake pilot plant testwork using their proprietary Lithium Hydroxide Process. The spodumene concentrate sample used was produced during concentrator pilot plant operation in 2020. The spodumene concentrate was calcined by Metso Outotec at their laboratory in Oberursel, Germany. The calcined concentrate was then sent to Metso Outotec Research Center in Pori, Finland for hydrometallurgical testing.
The pilot plant flowsheet tested included: soda leaching, cold conversion, secondary conversion, ion exchange, and lithium hydroxide crystallization. The pilot plant operated for approximately 10 days. Roughly 100 kg of calcined spodumene concentrate was fed to the pilot plant. The average total lithium extraction achieved in soda leaching and cold conversion was 89% during the first 136 h of operation. Process recycles were incorporated in the pilot plant with no significant accumulation of impurities in the process. First stage lithium hydroxide crystallization was operated continuously during the pilot plant. Second stage crystallization was operated in batches after the completion of the continuous pilot plant. Impurities levels in the final battery-quality lithium hydroxide monohydrate product were typically low with Al <10 ppm, Ca <10 ppm, Fe <20 ppm, K <10 ppm, and Si <40 ppm. All other metal impurities were below detection limits.
Based on the testwork completed, Metso Outotec expects that 195,000 t/y of SC6 will be required to produce 30,000 t/y of battery quality lithium hydroxide. Based on Metso Outotec’s estimate, the BFS study assumes 91% lithium conversion through the lithium hydroxide conversion plant.
Process Design
The concentrator process design is based on historical testwork including the 2021 variability testwork program. Lithium hydroxide manufacturing process design is based on pilot plant results and Metso Outotec experience. The simplified process flow diagram for the Project is shown in Figure 7.
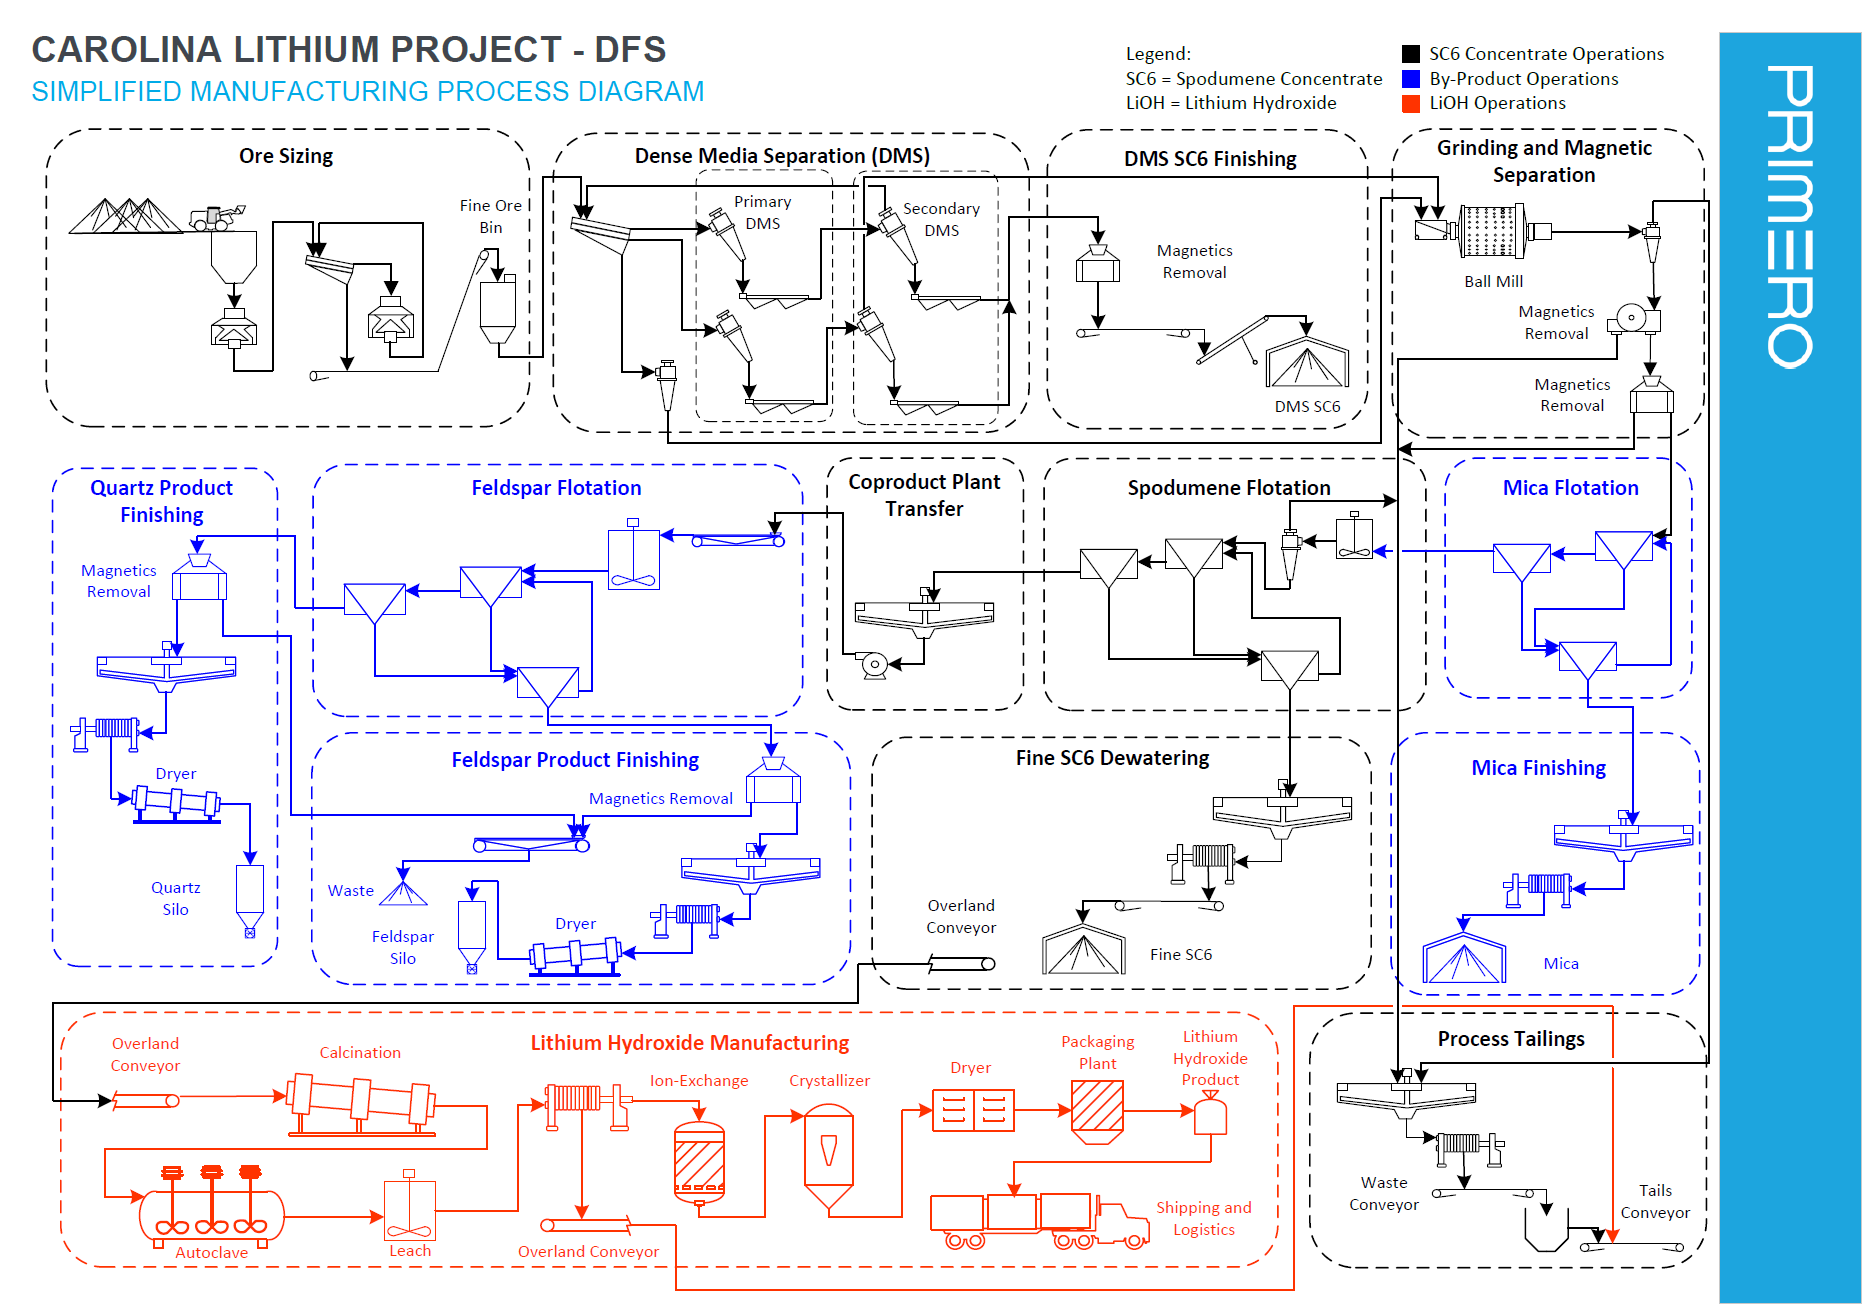
Figure 7 – Proposed Carolina Lithium Project block flow diagram
Site Plan
A detailed site plan including mining operations, concentrate operations, lithium hydroxide manufacturing, overburden and waste rock disposal, by-product manufacturing and ancillary facilities was developed by Marshall Miller and Primero Group in connection with the Project’s mine permit application submitted in August 2021. This plan is expected to be modified as additional properties are acquired in order to execute the mine plan as expressed in the BFS. Most notably, the BFS assumes that tonnes contained between external property boundaries and pit extents, currently constrained by permitting offset requirements, are mined as additional properties are acquired. Also, a secondary waste pile, located on currently controlled property, is not included in the current permit application but is needed to develop the reserves as shown in the BFS. Staged permitting is a common practice and should not be considered abnormal for a mining venture of this magnitude. Figure 8 shows the proposed mine permit plan for the proposed integrated manufacturing campus.
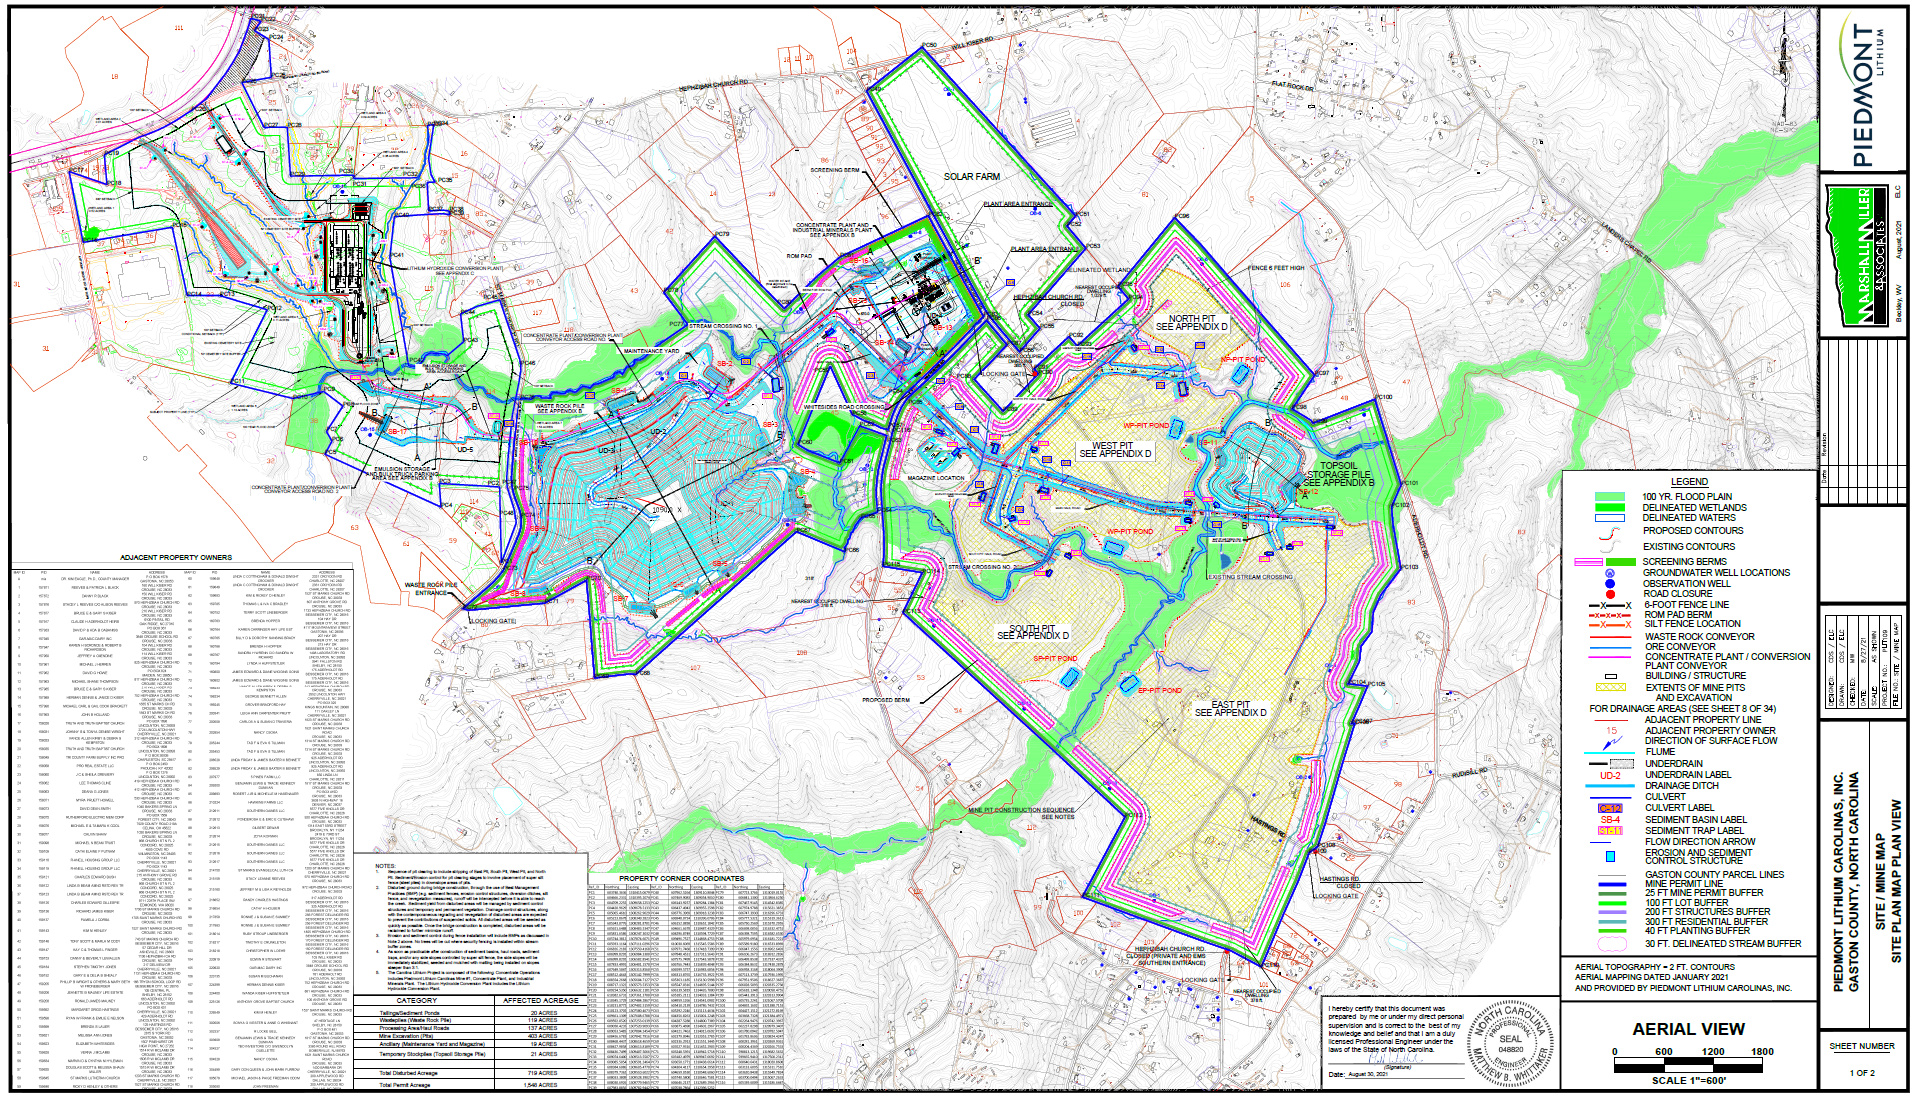
Figure 8 – Proposed integrated manufacturing campus site plan
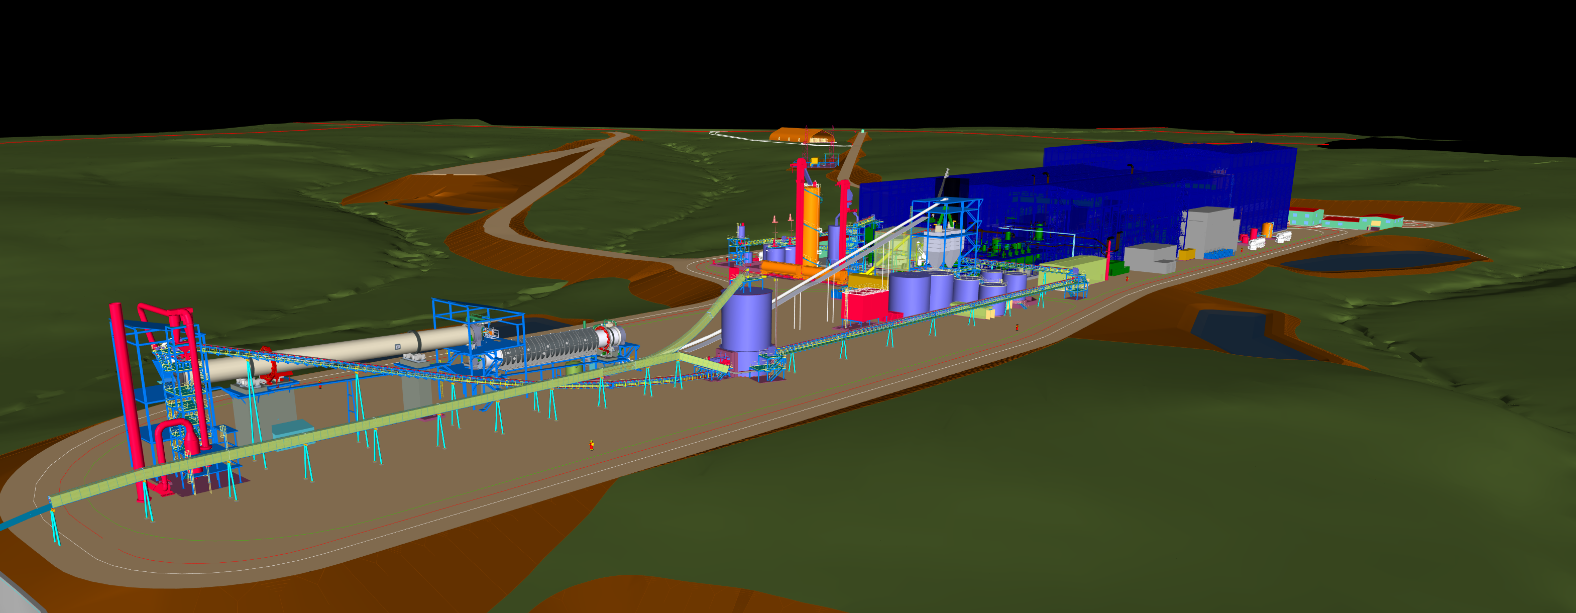
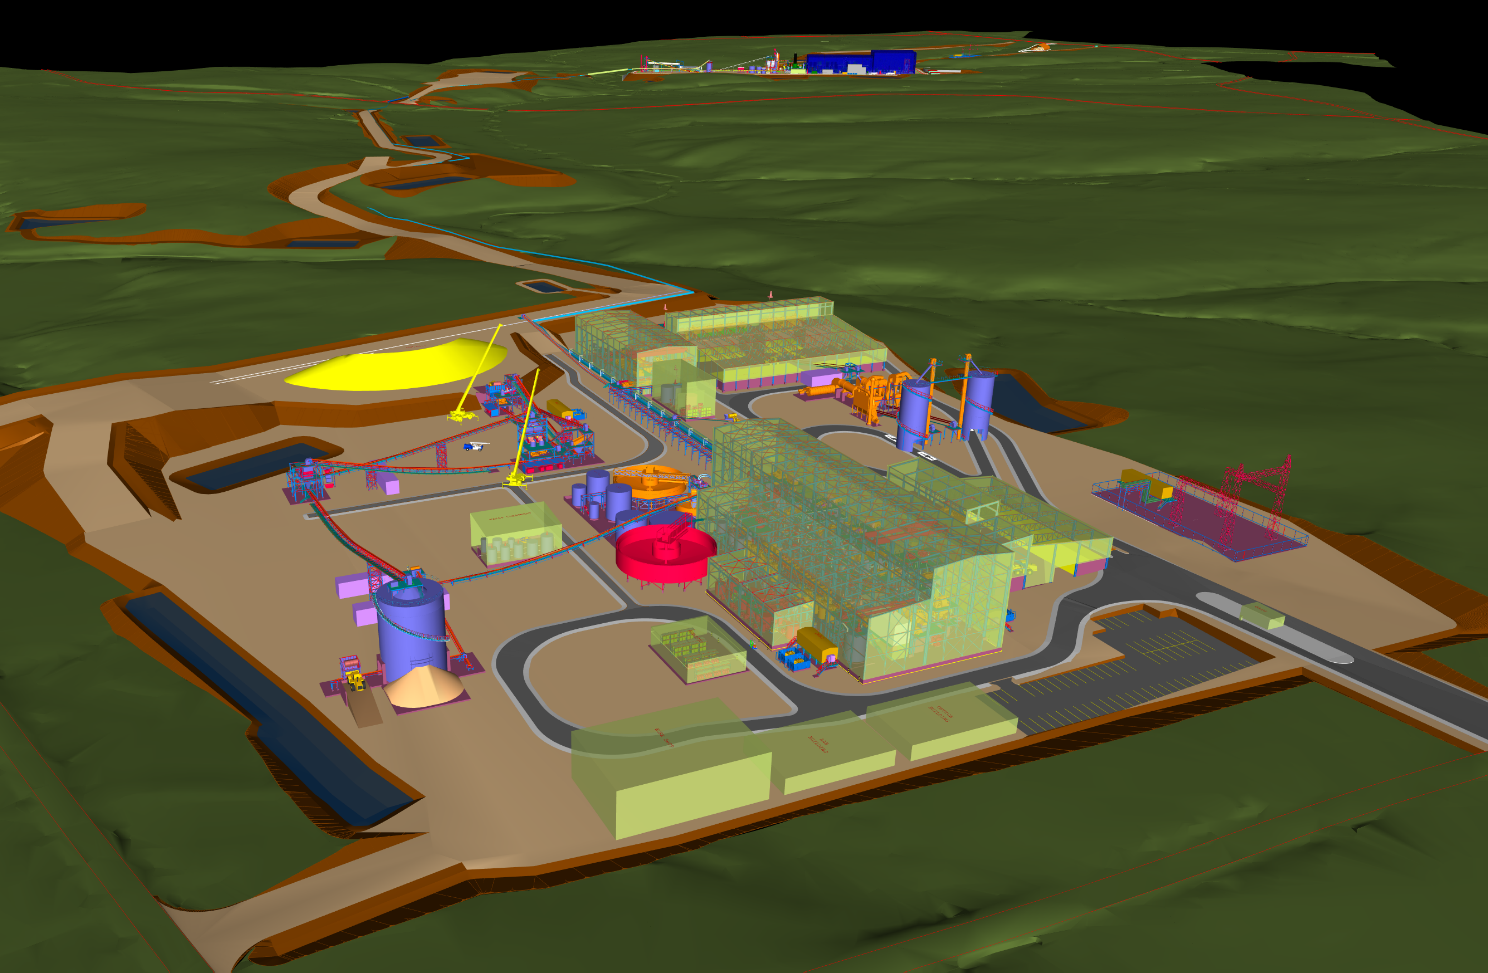
Navisworks models have been completed for the lithium hydroxide conversion operations (Figure 9) and spodumene concentrate facilities (Figure 10) to a BFS level of detail. Further optimization of the proposed layouts will be completed during front-end engineering design.
Infrastructure
Piedmont enjoys a superior infrastructure position relative to most lithium projects globally. The proposed site is approximately 25 miles west of Charlotte, North Carolina. The site is directly accessible by multiple state highways, CSX railroad, and is in close proximity to U.S. Highway 321 and U.S. Interstate I-85.
Piedmont’s proposed Carolina Lithium operations are in proximity to four (4) major US ports:
- Charleston, SC, 197 miles
- Wilmington, NC, 208 miles
- Savannah, GA, 226 miles
- Norfolk, VA, 296 miles
Charlotte-Douglas International Airport is 20 miles from the proposed operations. Charlotte-Douglas is the 6th largest airport in the United States and has direct international routes to Canada, the Caribbean, South America, and Europe.
Temporary or permanent camp facilities will not be required as part of the Project. Furthermore, Livent Corporation and Albemarle Corporation operate lithium chemical plants in close proximity to the proposed Piedmont operations, and the local region is well serviced by fabrication, maintenance, and technical service contractors experienced in the sector.
Logistics
Most spodumene concentrate produced by Piedmont will be consumed by the Piedmont Carolina Lithium chemical plant. For internal transportation costs within the integrated campus, the cost to operate the belt conveyors connecting the concentrator and chemical plant are carried in the concentrator operating costs. Products are assumed to be shipped from site via truck.
Permitting
HDR Engineering has been retained by Piedmont to support permitting activities on the proposed Project.
In November 2019, the Company received a Clean Water Act Section 404 Standard Individual Permit from the US Army Corps of Engineers for the concentrate operations. This is the only federal permit required for the concentrate operations. The Company has also received a Section 401 Individual Water Quality Certification from the North Carolina Division of Water Resources. In connection with the 404 Permit an Environmental Assessment was completed for the Project which resulted in a Finding of No Significant Impact (“FONSI”).
The concentrate operations require a North Carolina State Mining Permit from the North Carolina Department of Environmental Quality (“NCDEQ”) Division of Energy, Mineral and Land Resources (“DEMLR”). The Company submitted a mine permit application to DEMLR on August 31, 2021. A public hearing in relation to the mine permit application was held on November 15, 2021. The Company has received additional information requests in connection with the mine permit application and is preparing a written response.
Piedmont previously received a Clean Air Act Title V synthetic minor permit from the NCDEQ Division of Air Quality for a proposed lithium hydroxide operation in Kings Mountain. Piedmont plans to apply for a new air permit for the Carolina Lithium integrated operations upon completion of the BFS.
Carolina Lithium remains subject to local rezoning and permit requirements. Piedmont remains in pre-application consultation with Gaston County at this time. A rezoning application will follow receipt of mine and air permits. The Company will apply for a special use permit required under the Gaston County UDO upon completion of the rezoning process.
The following environmental studies have been completed in connection with the Project (Table 16).
Marketing
Lithium Market Outlook
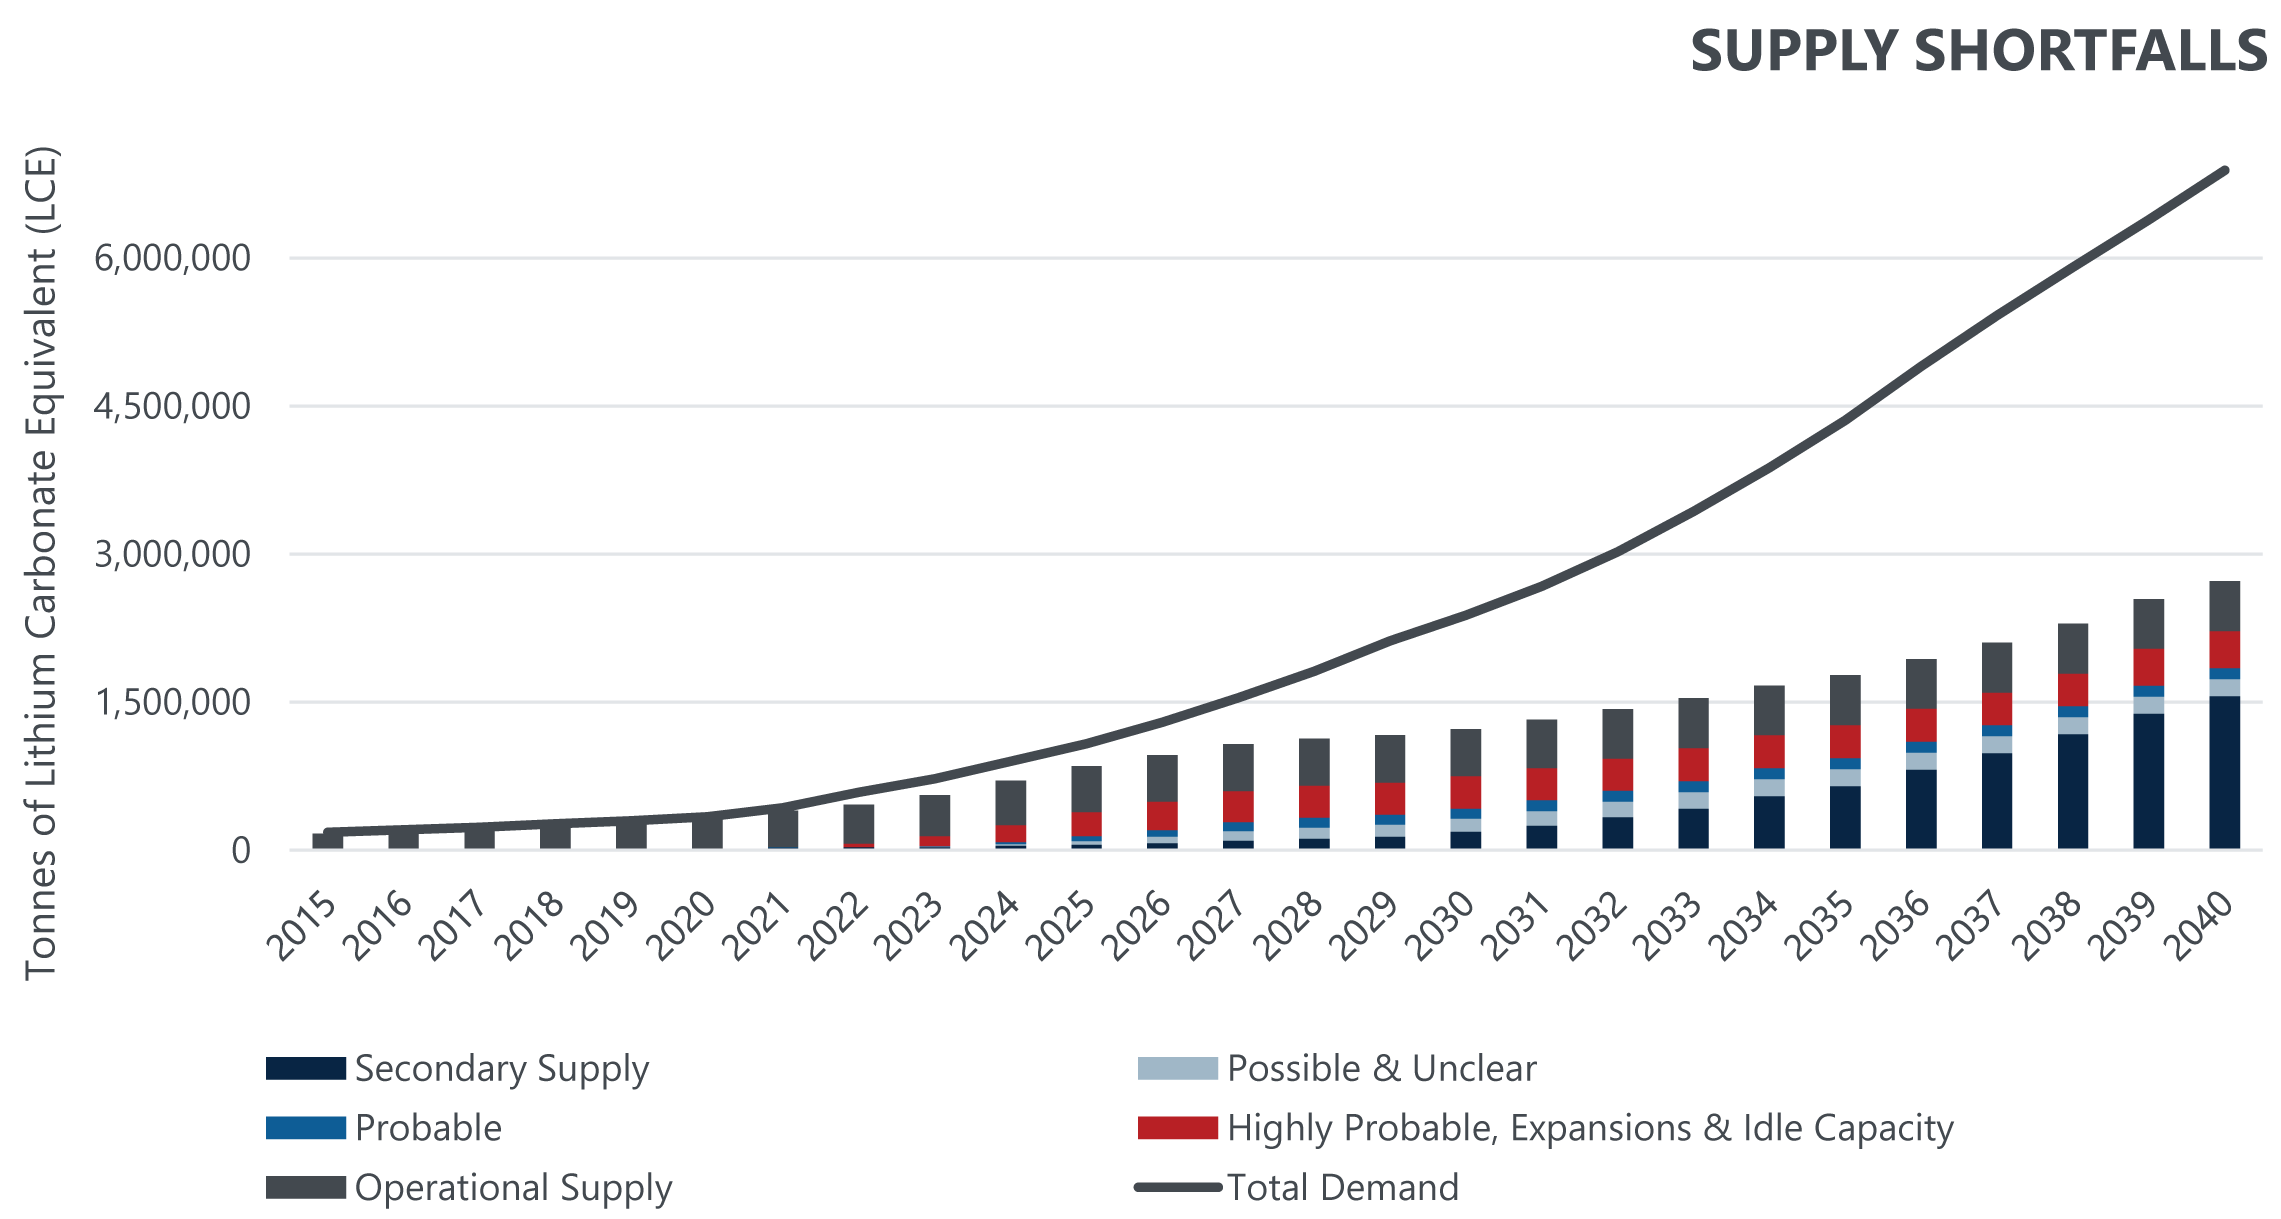
Benchmark Mineral Intelligence (“Benchmark”) reports that total battery demand will grow to 346 GWh in 2021 translating to 339kt of LCE demand in 2021, a growth of 51% over 2020 demand. Benchmark forecasts total demand in 2021 to be 473kt on an LCE basis.
Benchmark further expects the market to remain in a structural deficit (see Figure 11) for the foreseeable future as demand gets a head-start on supply. In the near impossible scenario that all projects come online on time as planned and without any issues, the first surplus will not occur until 2025. Benchmark believes that in this extreme case, a surplus could only be expected to last a few years before demand forces the market into a large deficit without further new projects yet undiscovered or developed.
The Company analyzed recent battery-grade lithium hydroxide and SC6 prices from Benchmark, JPMorgan and Macquarie for the period 2022-2025 as well as price forecasts recently announced by other lithium project developers.
| Table 17: Price Forecasts for Battery-Grade Lithium Hydroxide ($/tonne) | ||||
| Forecast | 2022 | 2023 | 2024 | 2025 |
| Benchmark Minerals | $20,600 | $26,200 | $25,200 | $20,900 |
| JPMorgan | $26,625 | $22,500 | $19,737 | $18,420 |
| Macquarie | $21,275 | $20,415 | $18,545 | $17,540 |
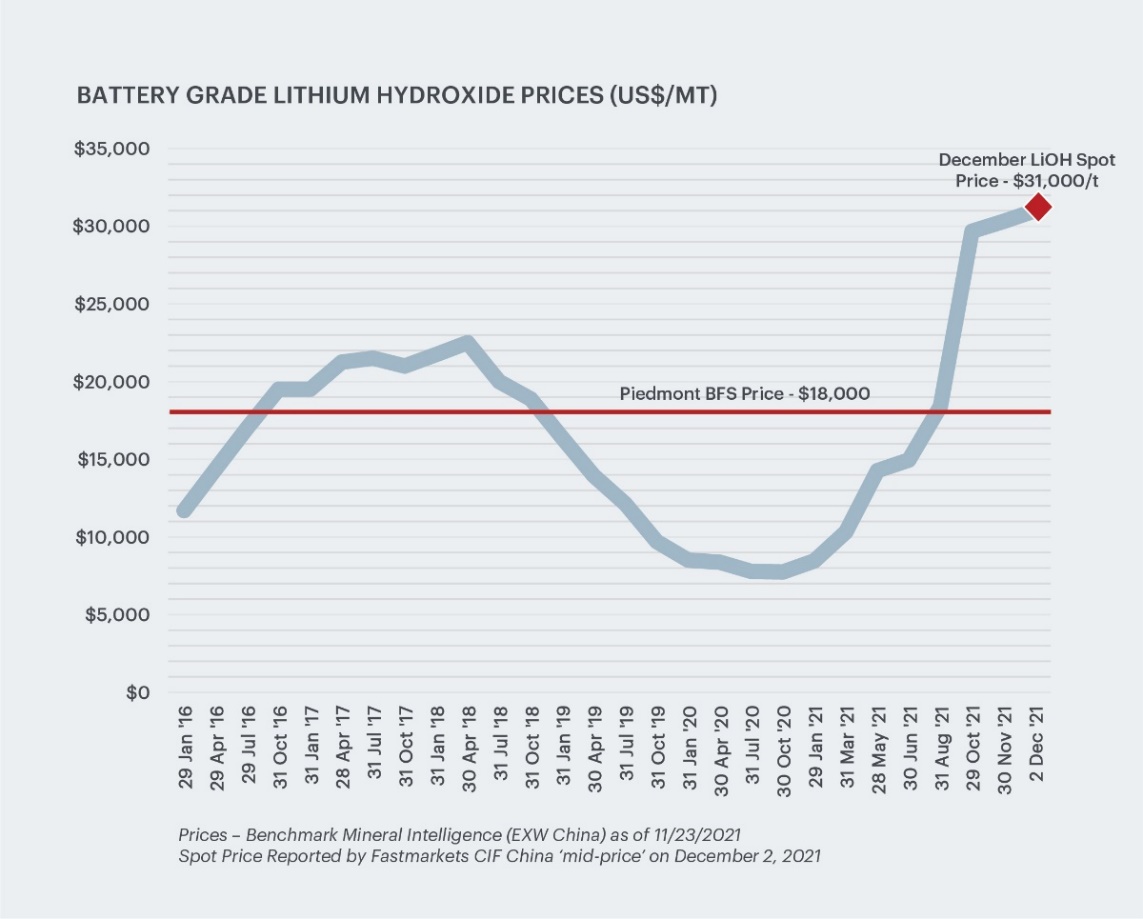
Based on these and other data this Study assumes long-term pricing of $18,000/t for battery quality lithium hydroxide and $900/t for spodumene concentrate for the life of the project. Figure 12 compares the pricing used in the BFS to historical China pricing for lithium hydroxide.
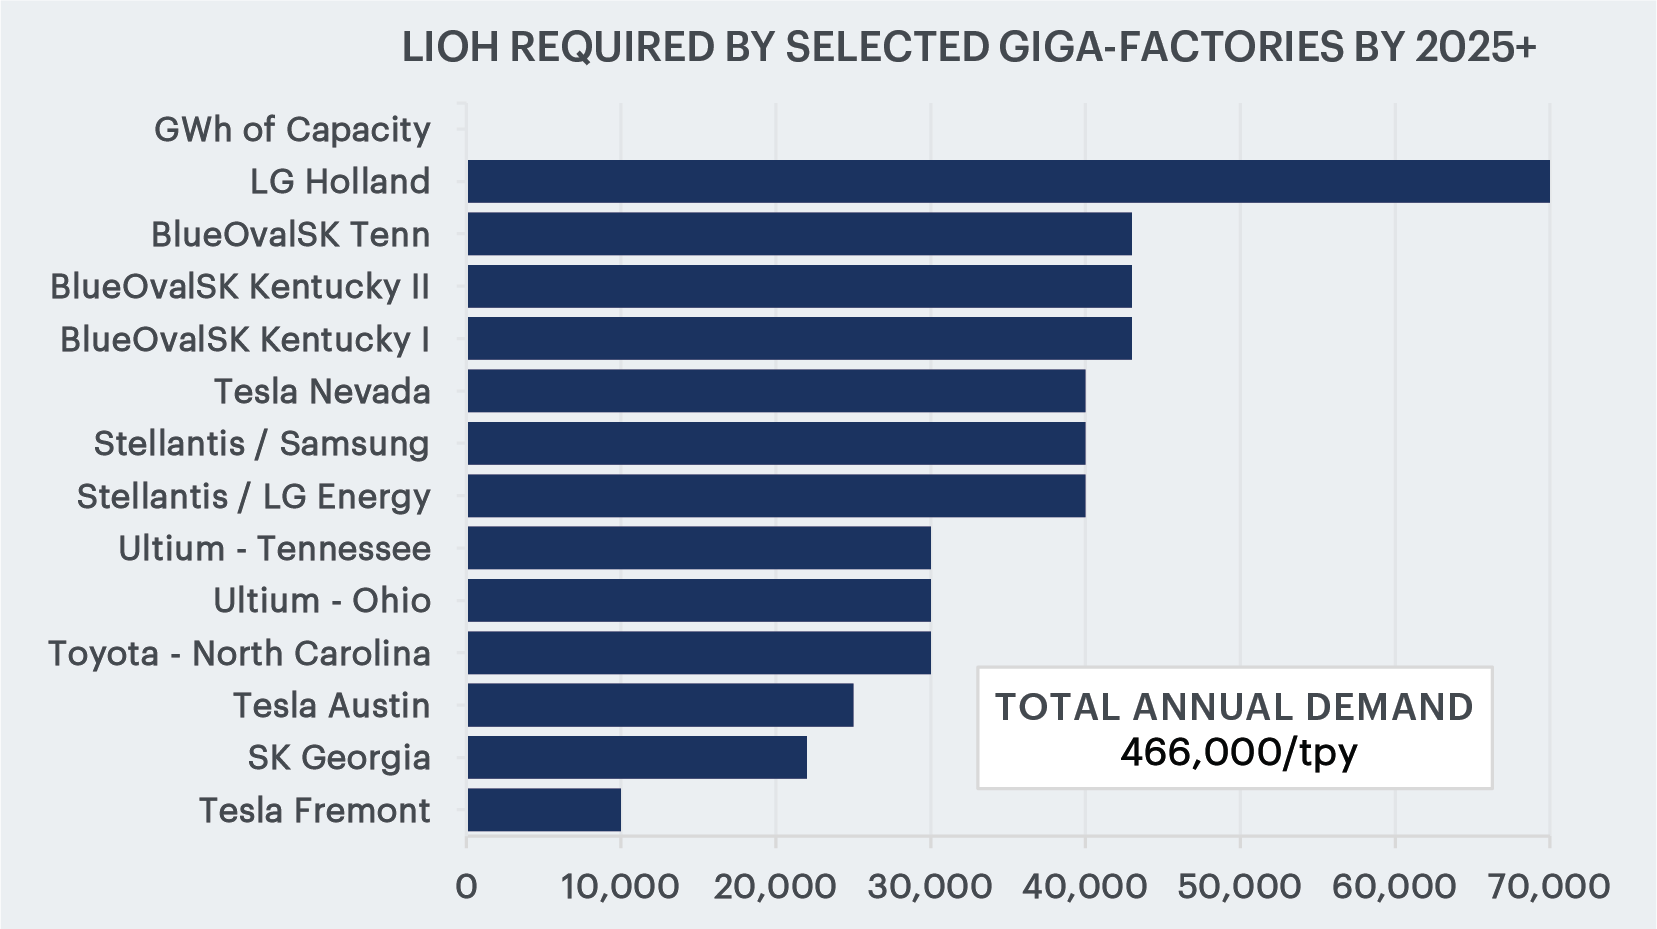
As shown in Figure 13 below North America is seeing considerable growth in battery plant capacity. Figure 14 below shows the corresponding lithium hydroxide demand for the announced U.S. battery plant capacity at full production.

Market Strategy
Piedmont is focused on establishing strategic partnerships with customers for battery grade lithium hydroxide with an emphasis on a customer base which is focused on EV demand growth in North America and Europe. Piedmont will concentrate this effort on these growing EV supply chains, particularly in light of the growing commitments of battery manufacturing by groups such as Ford, General Motors, Stellantis, Toyota, LGES, SK Innovation, Samsung SDI and others. Advanced discussions with prospective customers are ongoing.
By-Product Marketing
Piedmont proposes to produce quartz, feldspar and mica as by-products of spodumene concentrate operations. The Company engaged John Walker, an independent consultant, and Pronto Minerals, a joint venture between the Company and Ion Carbon & Materials, to assist the Company in estimating market opportunities for its by-products as shown in Table 18 below.
| Table 18: Market Forecasts and Basket Pricing for By-Products ($/t) | |||
| Quartz (t/y) | Feldspar (t/y) | Mica(t/y) | Average Realized Price ($/t) Mine Gate |
| 252,000 | 392,000 | 28,000 | $69.70 |
Operating Cost Estimates
Spodumene Concentrate Operating Cost Estimate
The SC6 operating cost estimate was prepared based on operating at approximately 1.90 million t/y run-of-mine ore producing an average of 242,000 t/y of SC6. Table 19 summarizes the estimated operating costs at steady-state. Costs are presented on an FOB chemical plant basis. Analcime by-product from lithium hydroxide manufacturing is assumed to have zero credit value.
Lithium Hydroxide Operating Cost Estimate
The operating cost estimate was prepared based on producing 30,000 t/y of lithium hydroxide monohydrate. Table 20 summarizes the estimated average operating costs for lithium hydroxide production over the life of mining operations and when using third-party spodumene concentrate.
| Table 20: Chemical Plant Cash Operating Cost Summary | ||||
|---|---|---|---|---|
| Steady-State First 10 Years | Average Life of Operations | |||
| Operating Cost Component | Total Average Annual Cost ($mm/y) | Cost $/t LiOH | Total Average Annual Cost ($mm/y) | Cost $/t LiOH |
| Salaries | $10.0 | $334 | $10.0 | $339 |
| Operating Consumables | $30.5 | $1,017 | $30.5 | $1,027 |
| Power | $6.4 | $214 | $6.4 | $218 |
| Maintenance | $3.2 | $107 | $3.2 | $108 |
| Laboratory and QA/QC | $2.1 | $70 | $2.1 | $70 |
| Other Costs | $1.1 | $32 | $1.1 | $32 |
| Subtotal conversion costs | $53.3 | $1,774 | $53.3 | $1,794 |
| SC6 supply costs (cash cost basis) | $45.8[16] | $1,527 | $123.5[17] | $4,131 |
| G&A | $10.7 | $356 | $9.3 | $310 |
| Total cash operating costs | $109.8 | $3,657 | $186.1 | $6,235 |
The operating cost estimate is based on Q4 2021 U.S. dollars with no escalation. Target accuracy of the operating cost estimate is ± 15%. Operating costs are based on steady-state production. The average operating costs include the commissioning and ramp-up phases of both concentrate operations and chemical plant operations. Third party SC6 sales are not included in the by-product credits.
During years 12-30, the chemical plant operations pay market price for spodumene concentrate either delivered CIF to the port of Charleston, South Carolina, or to DAP to Carolina Lithium’s rail siding in Cherryville, NC.
Operating costs assume that Carolina Lithium employs contract mining services.
Capital Cost Estimate
Table 21 highlights the total estimated capital expenditures for the Project. Variable contingency has been applied to project costs based on the level of engineering definition completed and the confidence level of supplier and contractor quotations. The capital cost estimate has a ±15% accuracy and is based on Q4 2021 costs.
Project Schedule
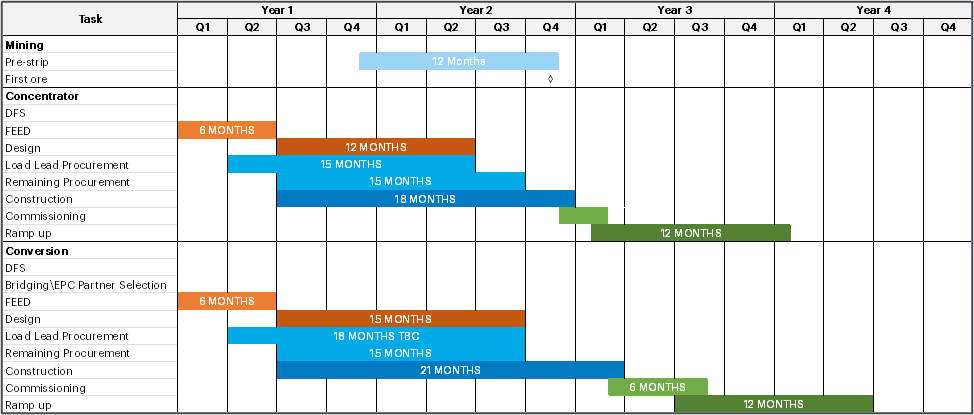
An integrated schedule was prepared as part of the BFS. The level 1 summary schedule is presented in Figure 16. For the purposes of financial modeling construction of the Carolina Lithium Project is assumed to commence at the start of Q3 2022. Project approvals including a state mining permit, rezoning, air permit, and special use permit are required before construction activities can commence on the Project.
Commercial production at the lithium hydroxide plant is estimated to start 24 months after the start of construction, with full production achieved within 12 months from the start of production.
Royalties, Taxes, Depreciation, and Depletion
The BFS project economics include the following key parameters related to royalties, tax, depreciation, and depletion allowances:
- Royalties of $1.00 per ROM tonne based on the average land option agreement
- Current North Carolina state corporate taxes are 2.5% but will reduce to 0% between 2024-2028
- Federal tax rate of 21% is applied and state corporate taxes are deductible from this rate
- Effective base tax rate of 22.975% in 2028 and reduces to 21% from 2028 onwards
- Depletion allowance of 22% is applied to the spodumene concentrate and mica sales prices. For spodumene concentrate used internal to the Carolina Lithium operations a transfer price equal to the market price has been used to calculate depletion.
- Depletion allowances for quartz and feldspar concentrates are 14% within the financial model
- Depreciation in the concentrate operations is based on Asset Class 10.0 – Mining in IRS Table B-1 using the general depreciation system (“GDS”) over 7 years with the double declining balance method
- Depreciation in the chemical plant is based on Asset Class 28.0 – Mfg. of Chemical and Allied Products in Table B-1 using GDS of 5 years with the double declining balance method
- Bonus depreciation of 80% has been applied based on the bonus depreciation allowance in the Tax Cuts and Jobs Act of 2017, where applicable
BFS Economics
Modeling Assumptions
A detailed project economical model was completed by the Company as part of the Study with the following key assumptions:
- Capital and operating costs are in accordance with technical study outcomes
- Chemical plant ramp-up is based on a 12-month time frame to nameplate production
- Financial modeling has been completed on a monthly basis, including estimated cash flow for construction activities and project ramp-up
- Mine scheduling was prepared on a quarterly basis for the first five years of operations, and annually thereafter.
- Pricing information for battery-grade lithium hydroxide sales and spodumene concentrate supply are based on a fixed price of $18,000/t for battery quality lithium hydroxide and $900/t for 6.0% Li2O spodumene concentrate
- Royalties, tax, depreciation, and depletion allowances according to stated assumptions
Financial Modelling
A comprehensive economic model has been prepared which fully integrates the Carolina Lithium Project including concentrate and chemical operations. The Study assumes a chemical plant production life of 30 years commencing 3 months after the start of mining operations. The chemical plant operates using self-supplied spodumene concentrate for the first 11 years of operations followed by market procurement of SC6 from year 12, including potentially from offtake sources currently controlled by or contracted with Piedmont. The mining production target is approximately 20.1 Mt at an average run of mine grade of 1.0% Li2O (fully-diluted) over an 11-year ore reserve life. The overall life of chemical plant operations is 30 years.
The current economic model is based on a monthly projection of capital costs and assumes that the full capital cost is spent across 21 months prior to commissioning of the concentrate operations and across 24 months prior to the commissioning of the chemical plant. Concentrate operations are assumed to ramp to full production over a one-year period and the chemical plant is also assumed to ramp to full production over a one-year period.
Payback Period
Payback periods for the Project constructed in a single phase is 3.5 years after the start of chemical plant operations or 5.5 years from the start of construction. Payback period is calculated on the basis of after-tax free cash flow.
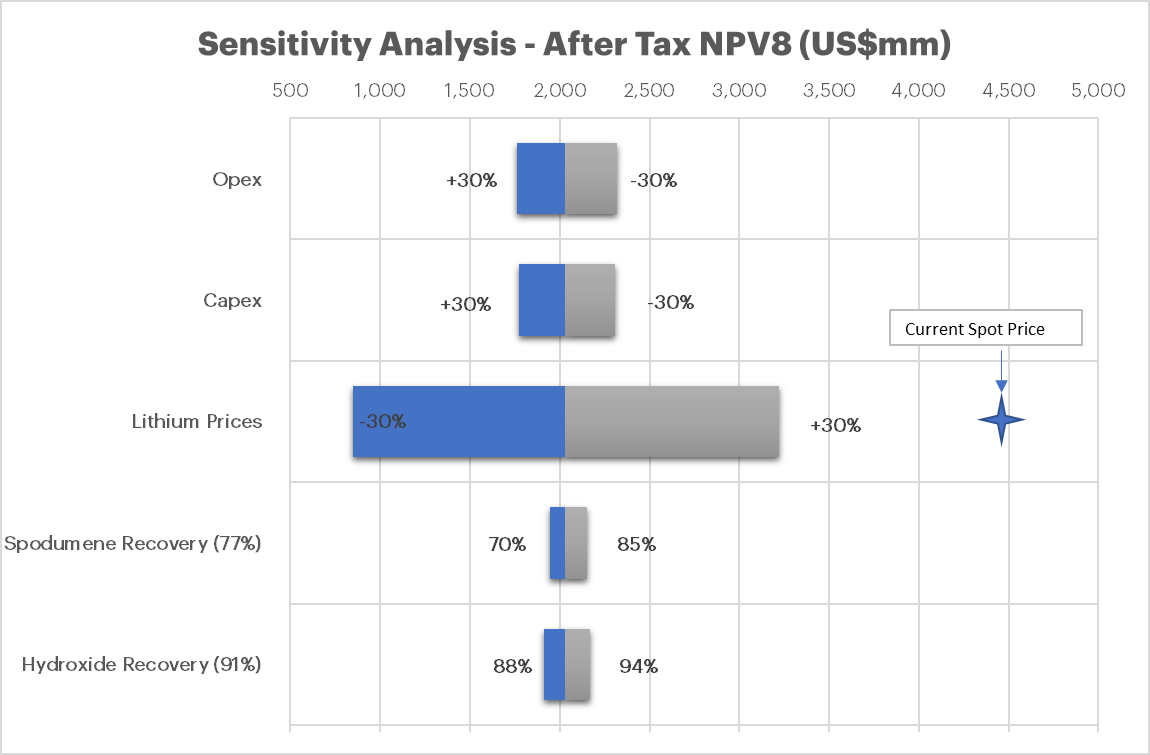
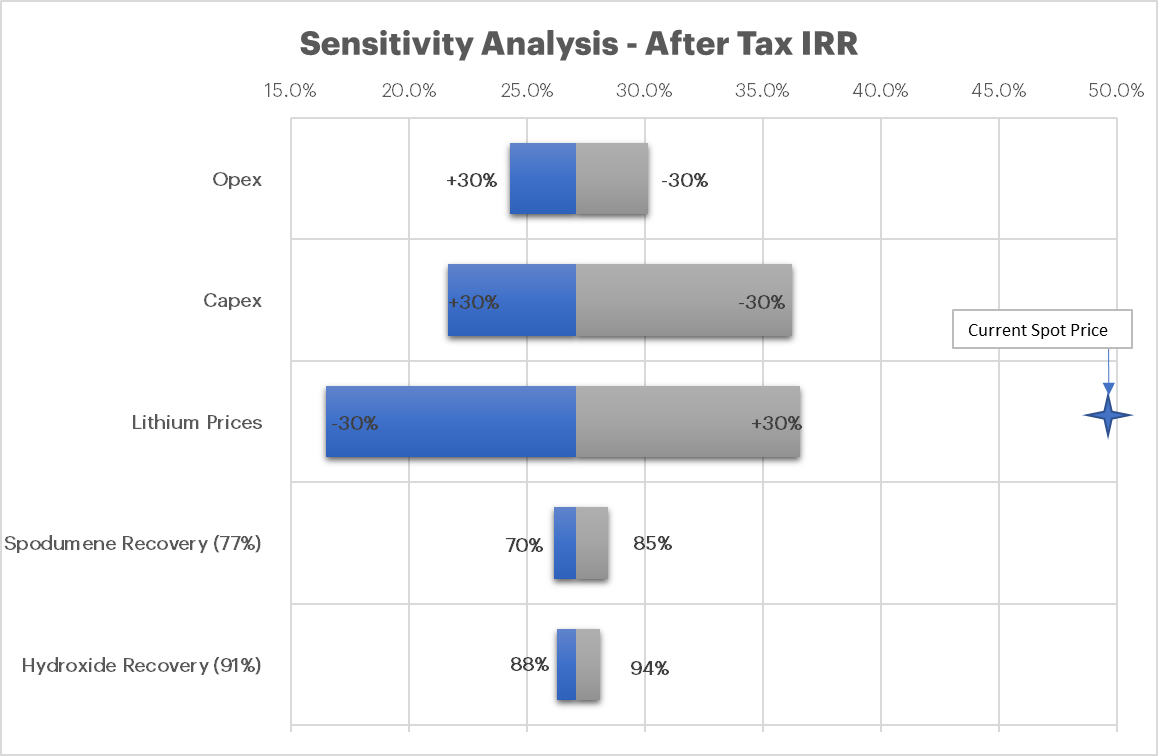
Sensitivity Analyses
The concentrate operations and chemical plant components of the Study have been designed to a BFS level of detail with an intended accuracy of ± 15%. Key inputs into the Study have been tested by pricing, capital cost, and operating cost sensitivities. The impact to after tax net present value is presented in Figure 17 while impact to project IRR is presented in Figure 18. Additionally, applying discount rates of 7% and 9% resulted in NPV7 of $2,360mm and NPV9 of $1,768mm.
Conclusions and Next Steps
The Study results demonstrate the potential for Carolina Lithium to become a major North American lithium hydroxide producer on a fully integrated spodumene mine to lithium hydroxide chemical plant basis. The Company will now concentrate on the following initiatives to drive the Project forward:
- Complete an expanded Scoping Study to define a Phase 2 lithium hydroxide operation using partner sourced spodumene concentrate
- Continue evaluation of environmentally sensitive issues for incorporation in mine planning
- Undertake bridging and optimization engineering activities and launch FEED engineering
- Selection of EPC contractor for execution of the Project
- Respond to additional requests for information from DEMLR and continue to advance mine permit approvals
- Complete and submit a new air permit application for the proposed 30,000 t/y Carolina Lithium Project
- Engage in further pre-application consultation with Gaston County in advance of rezoning and special use permit application submittals
- Complete formal submission of the Company’s Advanced Technology Vehicle Manufacturing program loan application
- Continue to evaluate opportunities to add quality assets to the Company’s portfolio
- Evaluate strategic partnering options in partnership with Evercore and JP Morgan
Cautionary Note to United States Investors Concerning Estimates of Measured, Indicated and Inferred Mineral Resources and Proven and Probable Ore Reserves
The information contained herein by Piedmont has been prepared in accordance with the requirements of the securities laws in effect in the United States and Australia. The terms “mineral resource”, “measured mineral resource”, “indicated mineral resource” and “inferred mineral resource” are used herein as defined by the U.S. Securities and Exchange Commission (“SEC”) in Regulation S-K, Item 1300 (“S-K 1300”) and as defined in accordance with the 2012 Edition of the Australasian Code for Reporting of Exploration Results, Mineral Resources and Ore Reserves (the “JORC Code”). The terms “Ore Reserves”, “Proven Ore Reserves”, and “Probable Ore Reserves” are used herein as defined by the U.S. Securities and Exchange Commission (“SEC”) in Regulation S-K, Item 1300 (“S-K 1300”) and as defined in accordance with the 2012 Edition of the Australasian Code for Reporting of Exploration Results, Mineral Resources and Ore Reserves (the “JORC Code”).
Competent Persons and Qualified Persons Statements
The information in this announcement that relates to Exploration Results is based on, and fairly represents, information compiled or reviewed by Mr. Lamont Leatherman, a Competent Person and Qualified Person, who is a Registered Member of the ‘Society for Mining, Metallurgy and Exploration’, a ‘Recognized Professional Organization’ (RPO). Mr. Leatherman is an employee of the Company. Mr. Leatherman has sufficient experience that is relevant to the style of mineralization and type of deposit under consideration and to the activity being undertaken to qualify as a Competent Person as defined in the 2012 Edition of the ‘Australasian Code for Reporting of Exploration Results, Mineral Resources and Ore Reserves’. Mr. Leatherman’s credentials also allow him to satisfy the requirements of a Qualified person in accordance with the United States Securities and Exchange Commission’s Modernization of Property Disclosures. Mr. Leatherman consents to the inclusion in the report of the matters based on his information in the form and context in which it appears.
The information in this announcement that relates to lithium Mineral Resources is extracted from our announcement entitled “Piedmont Increases Mineral Resources with Completion of Phase 5 Infill Drilling dated October 22, 2021. This announcement is available to view on the Company website at www.piedmontlithium.com. Piedmont confirms that: a) it is not aware of any new information or data that materially affects the information included in the original announcements; b) all material assumptions and technical parameters underpinning the Mineral Resources in the original announcements continue to apply and have not materially changed; and c) the form and context in which the Competent/Qualified Person’s findings are presented in this announcement have not been materially modified from the original announcements.
The information in this announcement that relates to Metallurgical Testwork Results is based on, and fairly represents, information compiled or reviewed by Dr. Jarrett Quinn, a Competent and Qualified Person who is a Registered Member of Ordre des Ingénieurs du Québec’, a ‘Recognized Professional Organization’ (RPO). Dr. Quinn is a consultant to Primero Group Americas Inc. Dr. Quinn has sufficient experience that is relevant to the style of mineralization and type of deposit under consideration and to the activity being undertaken to qualify as a Competent Person as defined in the 2012 Edition of the ‘Australasian Code for Reporting of Mineral Resources and Ore Reserves’ and a Qualified Person under S-K 1300 standards. Dr. Quinn consents to the inclusion in the report of the matters based on information in the form and context in which it appears.
The information in this announcement that relates to Process Design and Operating Costs is based on, and fairly represents, information compiled or reviewed by Mr. Andrew Siemon, a Competent and Qualified Person who is a Registered Member of the ‘Australian Institute of Mining and Metallurgy’, a ‘Recognized Professional Organization’ (RPO). Mr. Siemon is a full time employee of Primero Group Americas Inc. Mr. Siemon has sufficient experience that is relevant to the style of mineralization and type of deposit under consideration and to the activity being undertaken to qualify as a Competent Person as defined in the 2012 Edition of the ‘Australasian Code for Reporting of Mineral Resources and Ore Reserves’ and a Qualified Person under S-K 1300 standards. Mr. Siemon consents to the inclusion in this report of the matters based on his information in the form and context in which it appears.
The information in this announcement that relates to Capital Costs and Financial Analysis is based on, and fairly represents, information compiled or reviewed by Mr. Stephane Normandin, a Competent and Qualified Person who is a Registered Member of ‘Ordres des Ingenieurs du Quebec’, a ‘Recognized Professional Organization’ (RPO). Mr. Normandin is a full time employee of Primero Group Americas Inc. Mr. Normandin has sufficient experience that is relevant to the style of mineralization and type of deposit under consideration and to the activity being undertaken to qualify as a Competent Person as defined in the 2012 Edition of the ‘Australasian Code for Reporting of Mineral Resources and Ore Reserves’ and a Qualified Person under S-K 1300 standards. Mr. Normandin consents to the inclusion in this report of the matters based on his information in the form and context in which it appears.
The information in this announcement that relates to Mining Engineering, Mining Schedule, Mining Costs & Ore Reserves is based on information compiled by Mr. Chris Scott and reviewed by Dr. Steven Keim, both of whom are employees of Marshall Miller and Associates (MM&A). Dr. Keim takes overall responsibility as Competent and Qualified Person for the portions of the work completed by MM&A. Dr. Steven Keim is a Competent Person who is a Registered Member of the ‘Society for Mining, Metallurgy & Exploration Society’, a ‘Recognized Professional Organization’ (RPO). Dr. Keim has sufficient experience, which is relevant to the style of mineral extraction under consideration, and to the activity he is undertaking, to qualify as Competent Person in terms of the JORC Code (2012 Edition) and a Qualified Person under S-K 1300 standards. Dr. Keim has reviewed this document and consents to the inclusion in this report of the matters based on his information in the form and context within which it appears.
Forward Looking Statements
This announcement may include forward-looking statements. These forward-looking statements are based on Piedmont’s expectations and beliefs concerning future events. Such forward-looking statements concern Piedmont’s anticipated results and progress of its operations in future periods, planned exploration and, if warranted, development of its properties and plans related to its business and other matters that may occur in the future. These statements relate to analyses and other information that are based on forecasts of future results, estimates of amounts not yet determinable and assumptions of management. All statements contained herein that are not clearly historical in nature are forward-looking, and the words “anticipate,” “believe,” “expect,” “estimate,” “may,” “might,” “will,” “could,” “can,” “shall,” “should,” “would,” “leading,” “objective,” “intend,” “contemplate,” “design,” “predict,” “potential,” “plan,” “target” and similar expressions are generally intended to identify forward-looking statements.
Forward-looking statements are subject to a variety of known and unknown risks, uncertainties and other factors which could cause actual events or results to differ from those expressed or implied by the forward-looking statements. Forward-looking statements in this release include, but are not limited to, statements with respect to risks related to:
- Piedmont’s operations being further disrupted and Piedmont’s financial results being adversely affected by public health threats, including the novel coronavirus pandemic;
- Piedmont’s limited operating history in the lithium industry;
- Piedmont’s status as an exploration stage company, including Piedmont’s ability to identify lithium mineralization and achieve commercial lithium mining;
- mining, exploration and mine construction, if warranted, on Piedmont’s properties, including timing and uncertainties related to acquiring and maintaining mining, exploration, environmental and other licenses, permits, access rights or approvals in Gaston County, North Carolina, the Province of Quebec, Canada and Ghana as well as properties that Piedmont may acquire or obtain an equity interest in the future;
- completing required permitting, zoning and re-zoning activities required to commence mining and processing operations for the Carolina Lithium Project;
- Piedmont’s ability to achieve and maintain profitability and to develop positive cash flows from Piedmont’s mining and processing activities;
- Piedmont’s estimates of mineral reserves and resources and whether mineral resources will ever be developed into mineral reserves;
- investment risk and operational costs associated with Piedmont’s exploration activities;
- Piedmont’s ability to develop and achieve production on Piedmont’s properties;
- Piedmont’s ability to enter into and deliver products under supply agreements;
- the pace of adoption and cost of developing electric transportation and storage technologies dependent upon lithium batteries;
- Piedmont’s ability to access capital and the financial markets;
- recruiting, training and developing employees;
- possible defects in title of Piedmont’s properties;
- compliance with government regulations;
- environmental liabilities and reclamation costs;
- estimates of and volatility in lithium prices or demand for lithium;
- Piedmont’s common stock price and trading volume volatility;
- the development of an active trading market for Piedmont’s common stock; and
- Piedmont’s failure to successfully execute Piedmont’s growth strategy, including any delays in Piedmont’s planned future growth.
All forward-looking statements reflect Piedmont’s beliefs and assumptions based on information available at the time the assumption was made. These forward-looking statements are not based on historical facts but rather on management’s expectations regarding future activities, results of operations, performance, future capital and other expenditures, including the amount, nature and sources of funding thereof, competitive advantages, business prospects and opportunities. By its nature, forward-looking information involves numerous assumptions, inherent risks and uncertainties, both general and specific, known and unknown, that contribute to the possibility that the predictions, forecasts, projections or other forward-looking statements will not occur. Although Piedmont have attempted to identify important factors that could cause actual results to differ materially from those described in forward-looking statements, there may be other factors that cause results not to be as anticipated, estimated or intended. Should one or more of these risks or uncertainties materialize, or should underlying assumptions prove incorrect, actual results may vary materially from those anticipated, believed, estimated, or expected. Piedmont cautions readers not to place undue reliance on any such forward-looking statements, which speak only as of the date made. Except as otherwise required by the securities laws of the United States, Piedmont disclaims any obligation to subsequently revise any forward-looking statements to reflect events or circumstances after the date of such statements or to reflect the occurrence of anticipated or unanticipated events. Piedmont qualifies all the forward-looking statements contained in this release by the foregoing cautionary statements.
Based on the assumptions made as part of the Carolina Lithium Project’s BFS announcement dated December 14, 2021.
EBITDA defined as earnings before interest, taxes, depletion, depreciation, and amortization.
Indicative NPV and IRR of the Carolina Lithium Project when applying current spot prices as reported by Fastmarkets on 12/03/21 of $31,000/t for LiOH and $2,300/t for SC6 for pricing assumptions in the project’s financial model.
- Based on the assumptions made as part of the Carolina Lithium Project’s BFS announcement dated December 14, 2021.
- EBITDA defined as earnings before interest, taxes, depletion, depreciation, and amortization.
- Indicative NPV and IRR of the Carolina Lithium Project when applying current spot prices as reported by Fastmarkets on 12/03/21 of $31,000/t for LiOH and $2,300/t for SC6 for pricing assumptions in the project’s financial model.
- Carolina Lithium AISC presented based on December 2021 BFS results showing Piedmont’s steady-state AISC during the first 10 years of operations. All other costs shown based on Roskill May 2021 cost curve but assuming $900/t SC6 input costs for Merchant Converters to match BFS pricing assumptions. ↑
- Water scarcity values published by AWARE and available at wulca-waterlca.org/aware/ LCA results previously announced on June 9, 2021 ↑
- Atlantic Lithium and Sayona are spodumene projects in which the Company has equity interests and offtake agreements ↑
- References to $ in this announcement are United States Dollars. ↑
- Due to rounding the capital costs as presented do not add to $988mm ↑
- Spodumene concentrate production in the BFS is a production target based solely on Ore Reserves, prior studies established production targets based on Indicated as well as Inferred Mineral Resources. There remains significant opportunity to increase the operational life of Carolina Lithium beyond 11 years by conversion of existing mineral resources to ore reserves or by discovery of additional resources within the TSB ↑
- Steady-state cash costs of LiOH production during years 3-10 using SC6 sourced from Carolina Lithium ↑
- Steady-state cash costs of SC6 production at Carolina Lithium at a BFS level from years 3-10 ↑
- Average annual EBITDA during years 3-10 of operations. The average annual EBITDA life of chemical plant is $346mm ↑
- The Terms “Feasibility Study” and “Bankable Feasibility Study” are defined and/or referred to by the JORC Code (2012 Edition) and the SEC adopting for release S-K 1300. With regards to both JORC and SEC rules, feasibility studies are intended to support the economic viability of Ore Reserves via a detailed engineering and financial analysis. The Bankable Feasibility Study in which this announcement relates includes assumptions pertaining to the production of lithium reserves currently controlled by the Company and processing of purchased spodumene concentrate from other entities. As such, the term “Feasibility Study” as referred to in this announcement presents a business case which includes costs and revenues associated with reserve and non-reserve material. With regards to assumptions related to the production of the company’s Ore Reserves, all engineering and financial analysis aligns with the requirements of JORC and SEC rules to meet feasibility level standards. While the feasibility study and this announcement present a business model which includes non-reserve material, the Company and its consultants have completed a stand-alone analysis of the Company’s reserves to document their economic viability absent assumptions of purchased spodumene material. ↑
- Overall metallurgical recovery from spodumene ore to lithium hydroxide monohydrate assumption within resource model ↑
- The metallurgical recovery of ore reserves is based on 77% recovery of ore to spodumene concentrate, and 91% metallurgical recovery of SC6 to battery quality lithium hydroxide as reported in this announcement. ↑
- Expenses attributable to SC6 delivered to the lithium hydroxide conversion plant for processing. ↑
- After depletion of Ore Reserves the model assumes that Carolina Lithium purchases SC6 at market rates of $900/t plus $35/t inland freight costs from U.S. port to Cherryville, NC. ↑